Transaction Monitoring Dashboard
Senior Product Designer
2022
Background
"Do you offer fraud prevention tools?"
This was a frequently asked question by both current and prospective customers of Marqeta.
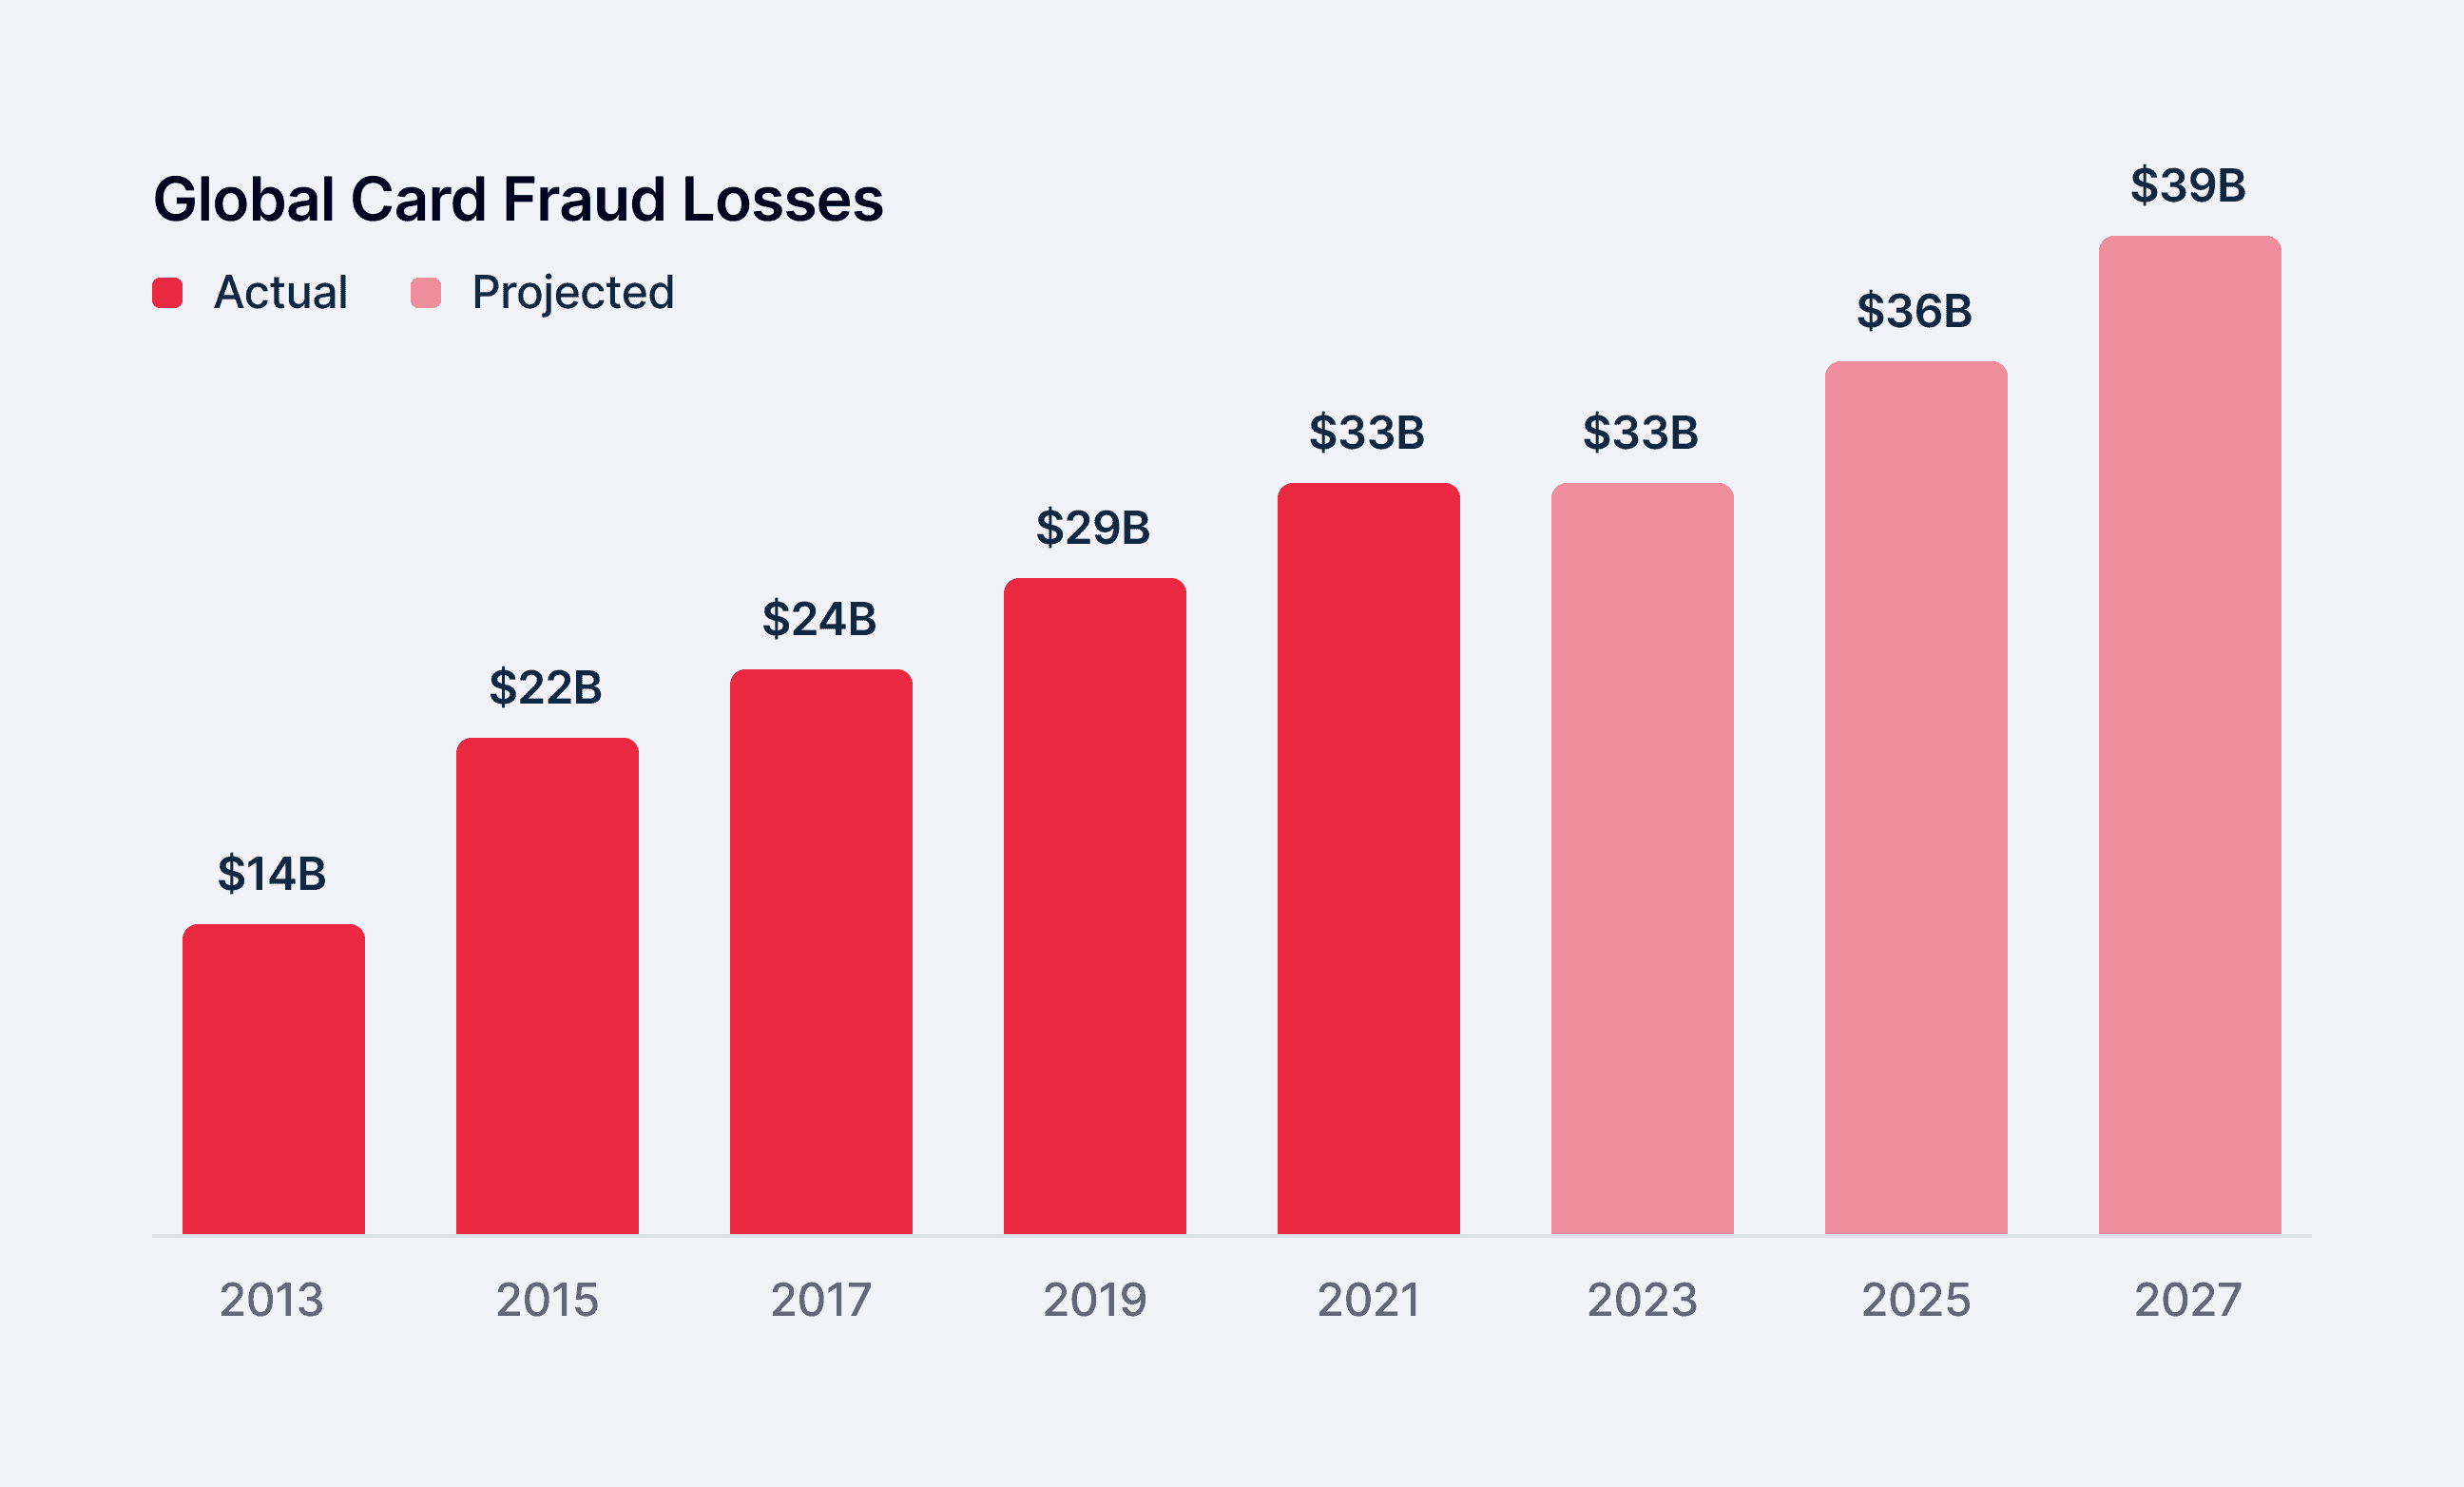
Payment fraud was a real concern for Marqeta's customers as undetected fraud led to large financial losses. At the time of this project, a report from McKinsey found that 82% of companies had been victims of card fraud and worldwide losses were projected to be around $39 billion by 2027.
As a card issuing platform, Marqeta offered few fraud prevention tools at the time. This product gap contributed to lost sales opportunities and unmet customer needs, which created urgency to deliver solutions quickly.
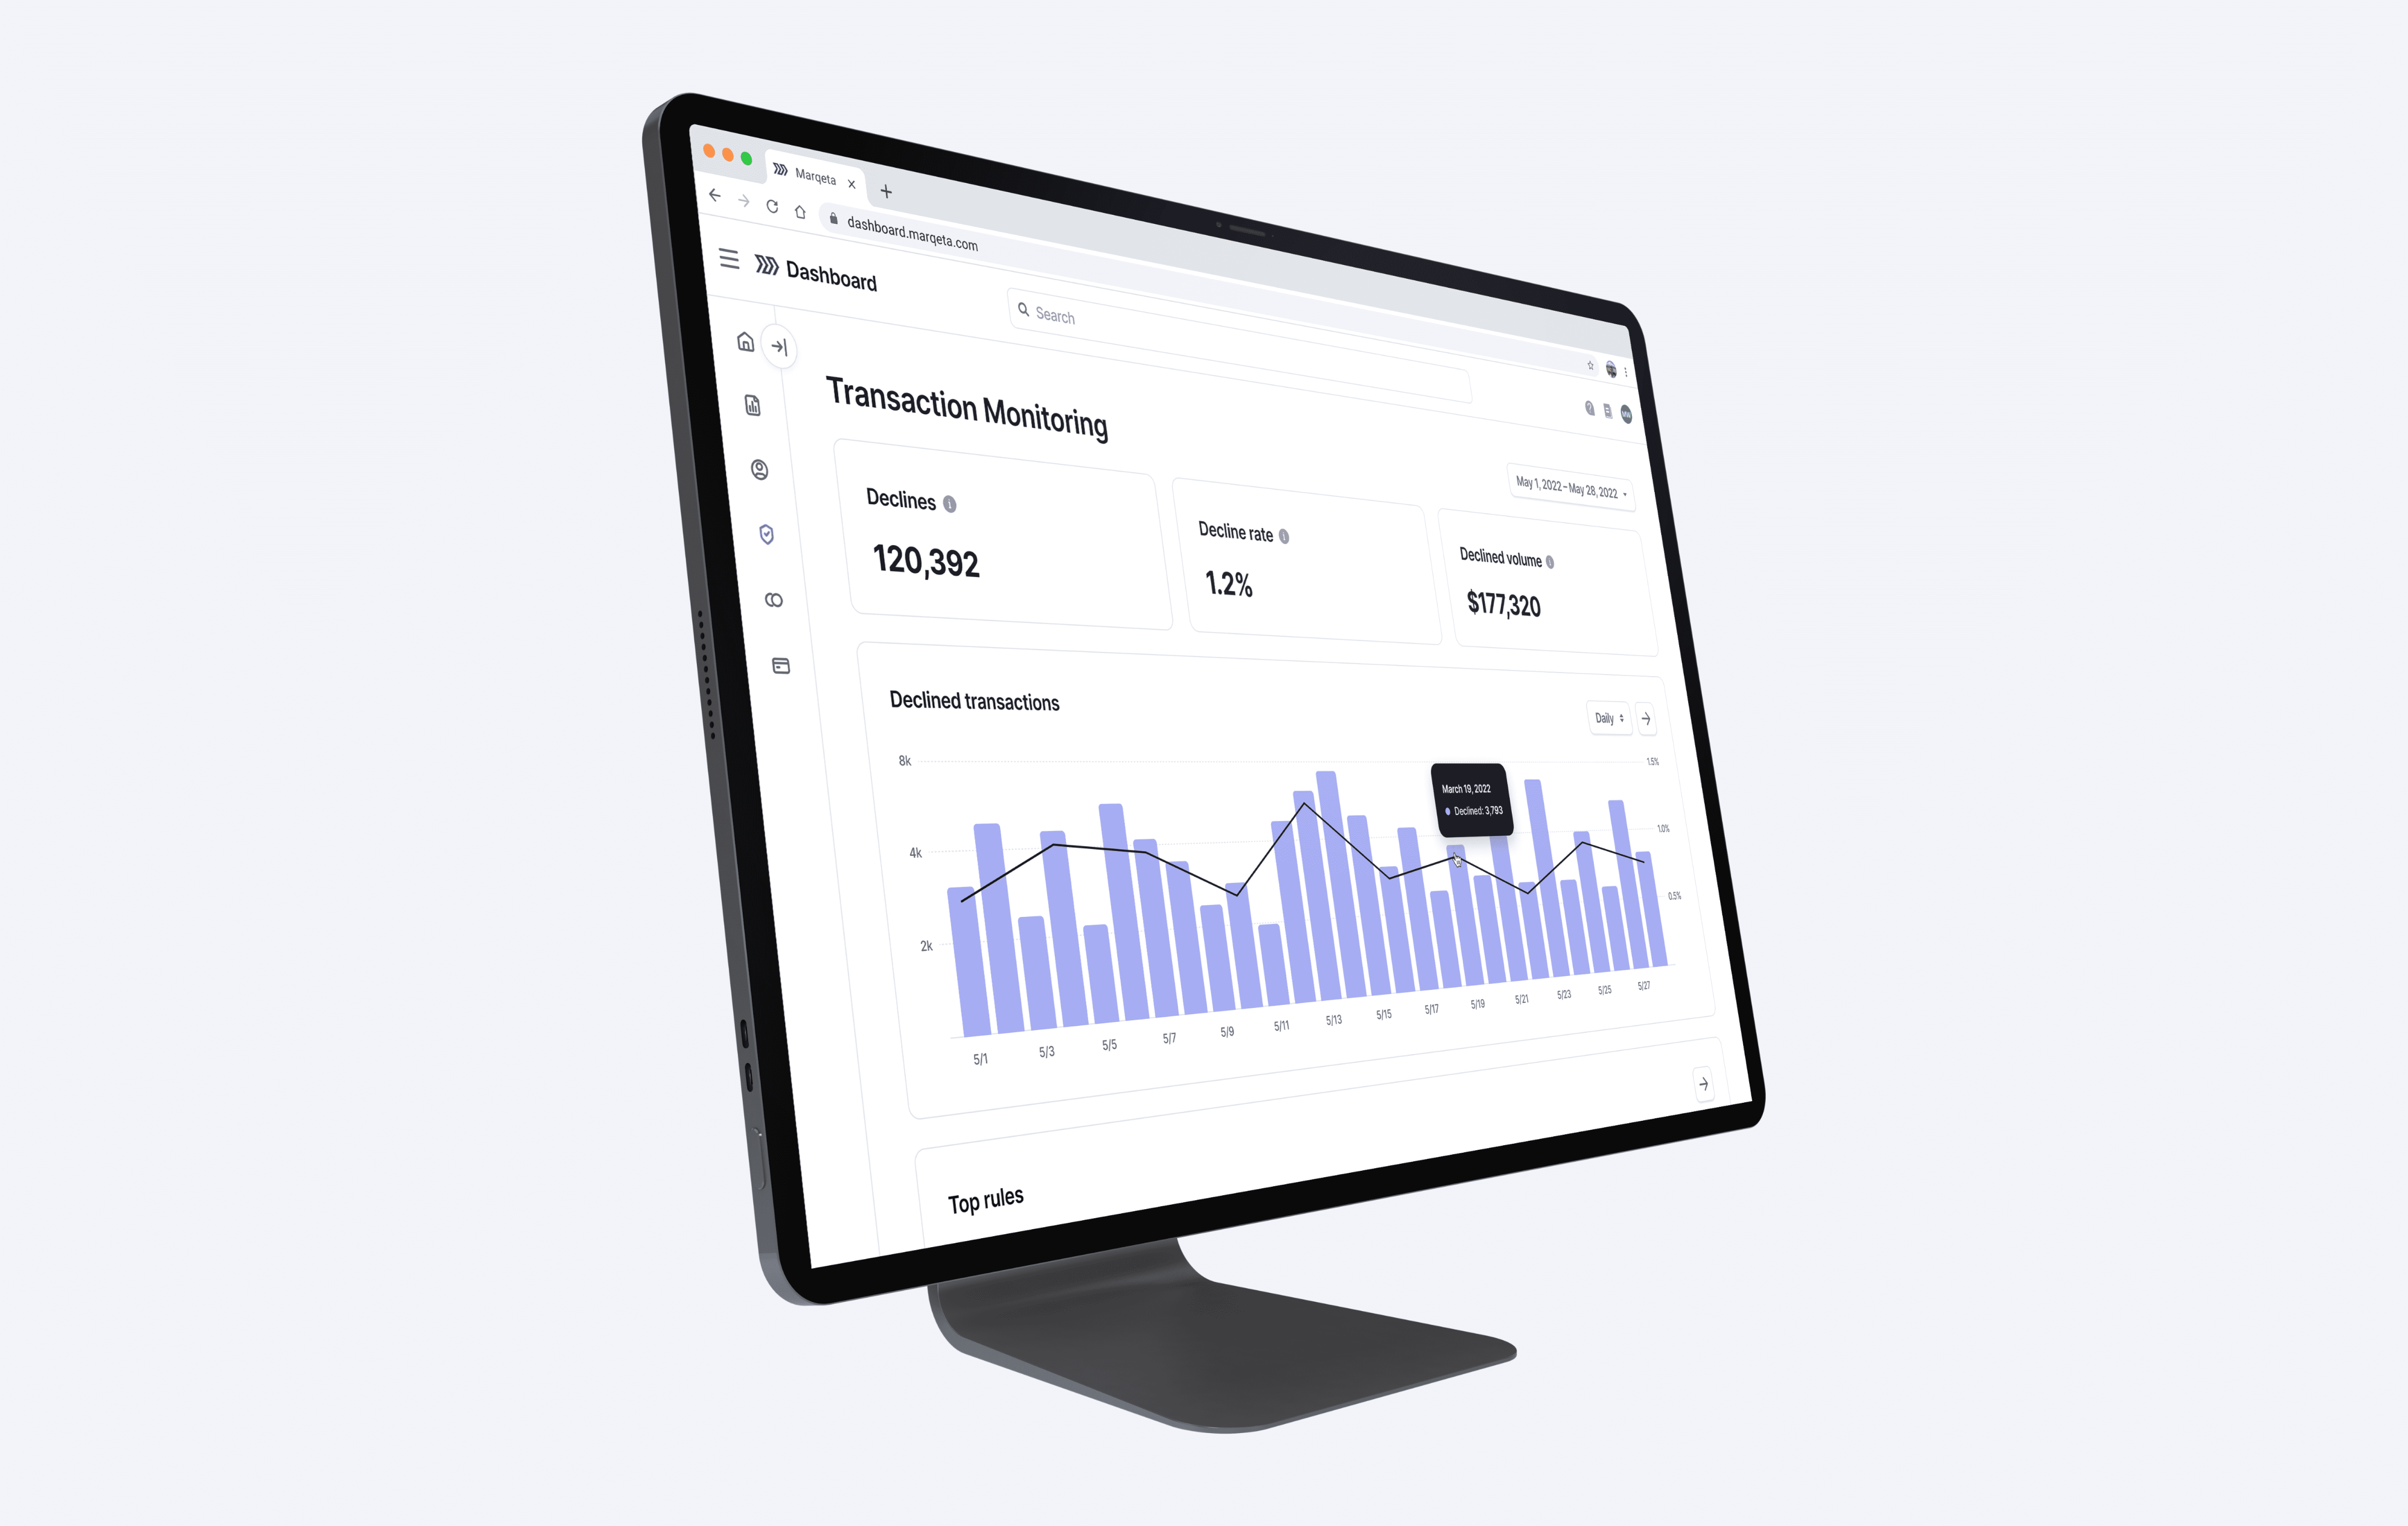
The following dashboard was designed to give risk operations teams clearer insights into their data and enabled them to make more informed decisions. As the lead designer on this project, I worked with a PM, a team of engineers, and data scientists to ensure the successful launch for this tool.
Problem
Raw data reports were difficult to interpret
At the time, risk analysts of Marqeta’s customers were using a third-party rules management service within the Marqeta Dashboard to create rules that flagged and declined suspicious transactions.
However, the results of these declined transactions were only available in raw data reports, making it challenging to interpret the results. Without clear visibility, it was difficult to determine whether their fraud rules were effectively targeting the right types of transactions, as declining too many legitimate ones harmed the cardholder experience and reduced revenue from interchange fees.

Goals
Providing analysts with insights to make more informed adjustments
After conducting interviews with risk analysts across five teams, my PM and I gathered enough insights to form a clear hypothesis. We hypothesized that providing a dashboard with clear, actionable insights would enable analysts to better understand how their fraud rules were performing and make more informed adjustments. By surfacing performance trends and key metrics, we wanted to give users the confidence in knowing when and how to optimize their rules.
Explorations
Finding common ground and alignment
As I began designing the dashboard, I explored multiple layout options and evaluated trade-offs with a diverse group of stakeholders, which included risk analysts, data scientists, and engineers. Since the product relied heavily on data interpretation, I partnered closely with SMEs to ensure information was being presented accurately, while remaining intuitive and actionable for users.
My primary goal was to present data efficiently, while maintaining a balance between providing critical information and avoiding content overload that could lead to excessive scrolling.


Final Designs
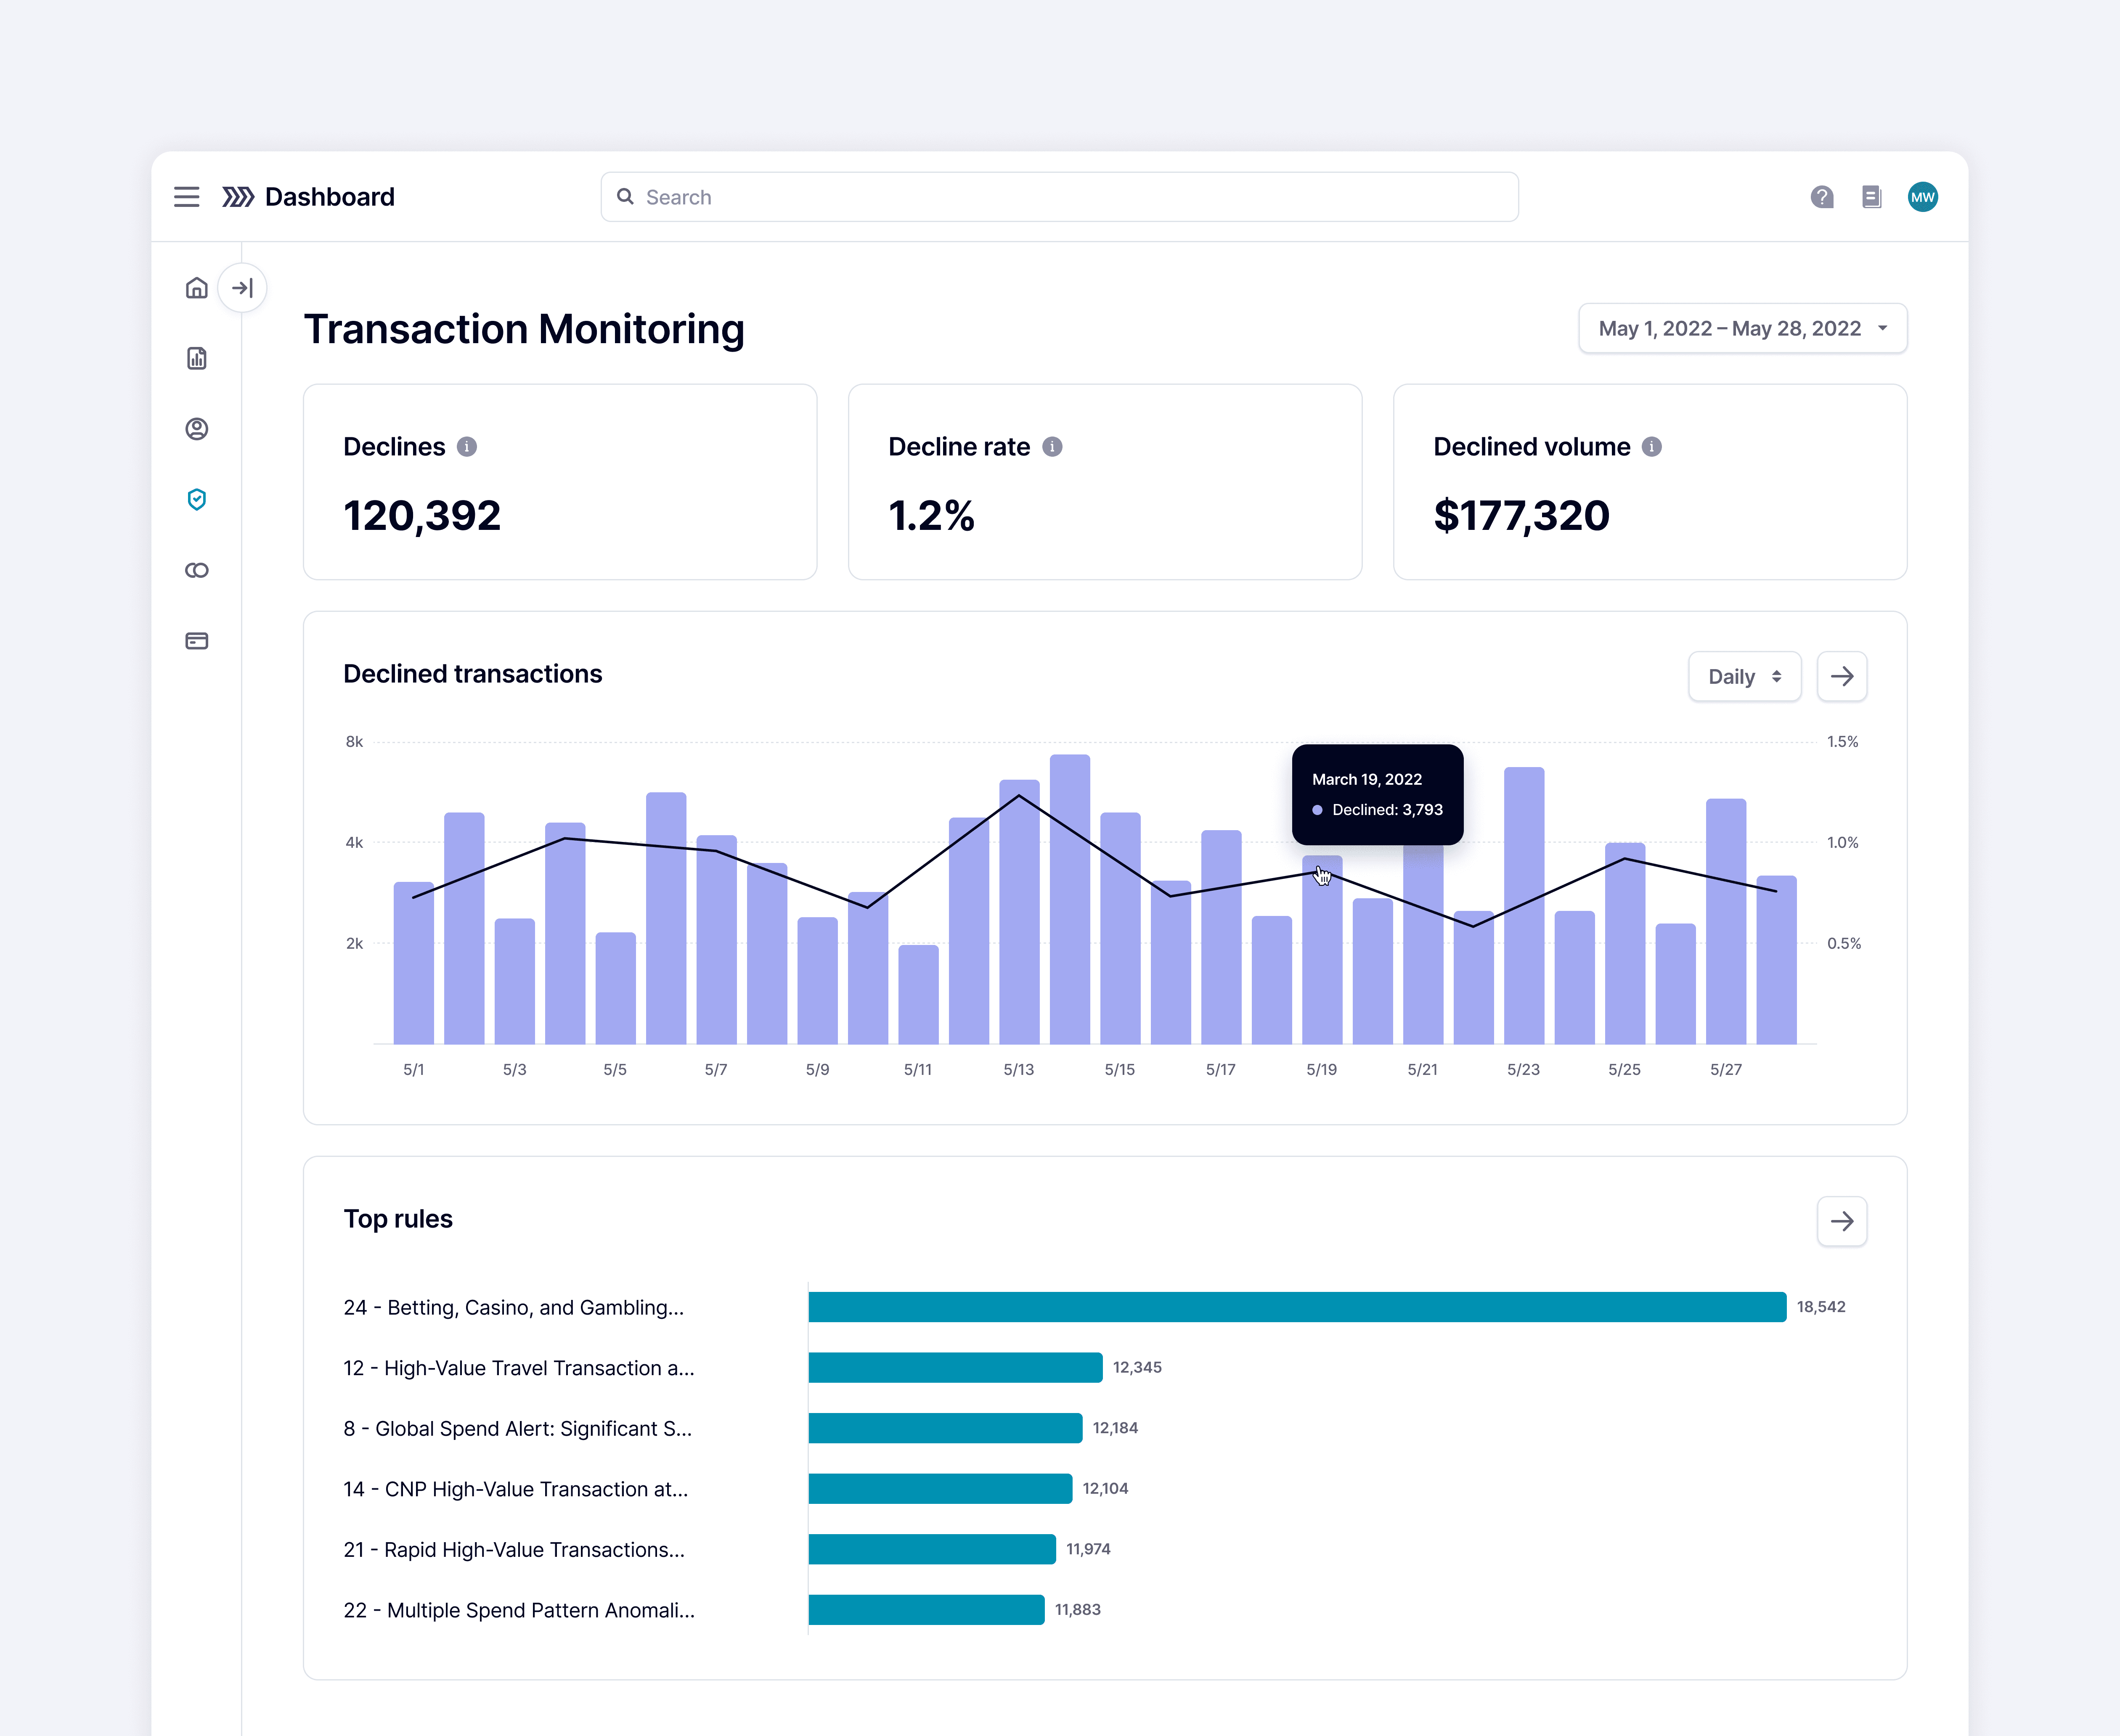
Understanding data at a glance
Since this was an MVP, our goal was to deliver a focused, lightweight dashboard that solved the most critical user needs. We prioritized shipping quickly so risk teams could begin using the product, which allowed us to validate assumptions and iterate based on real customer feedback.
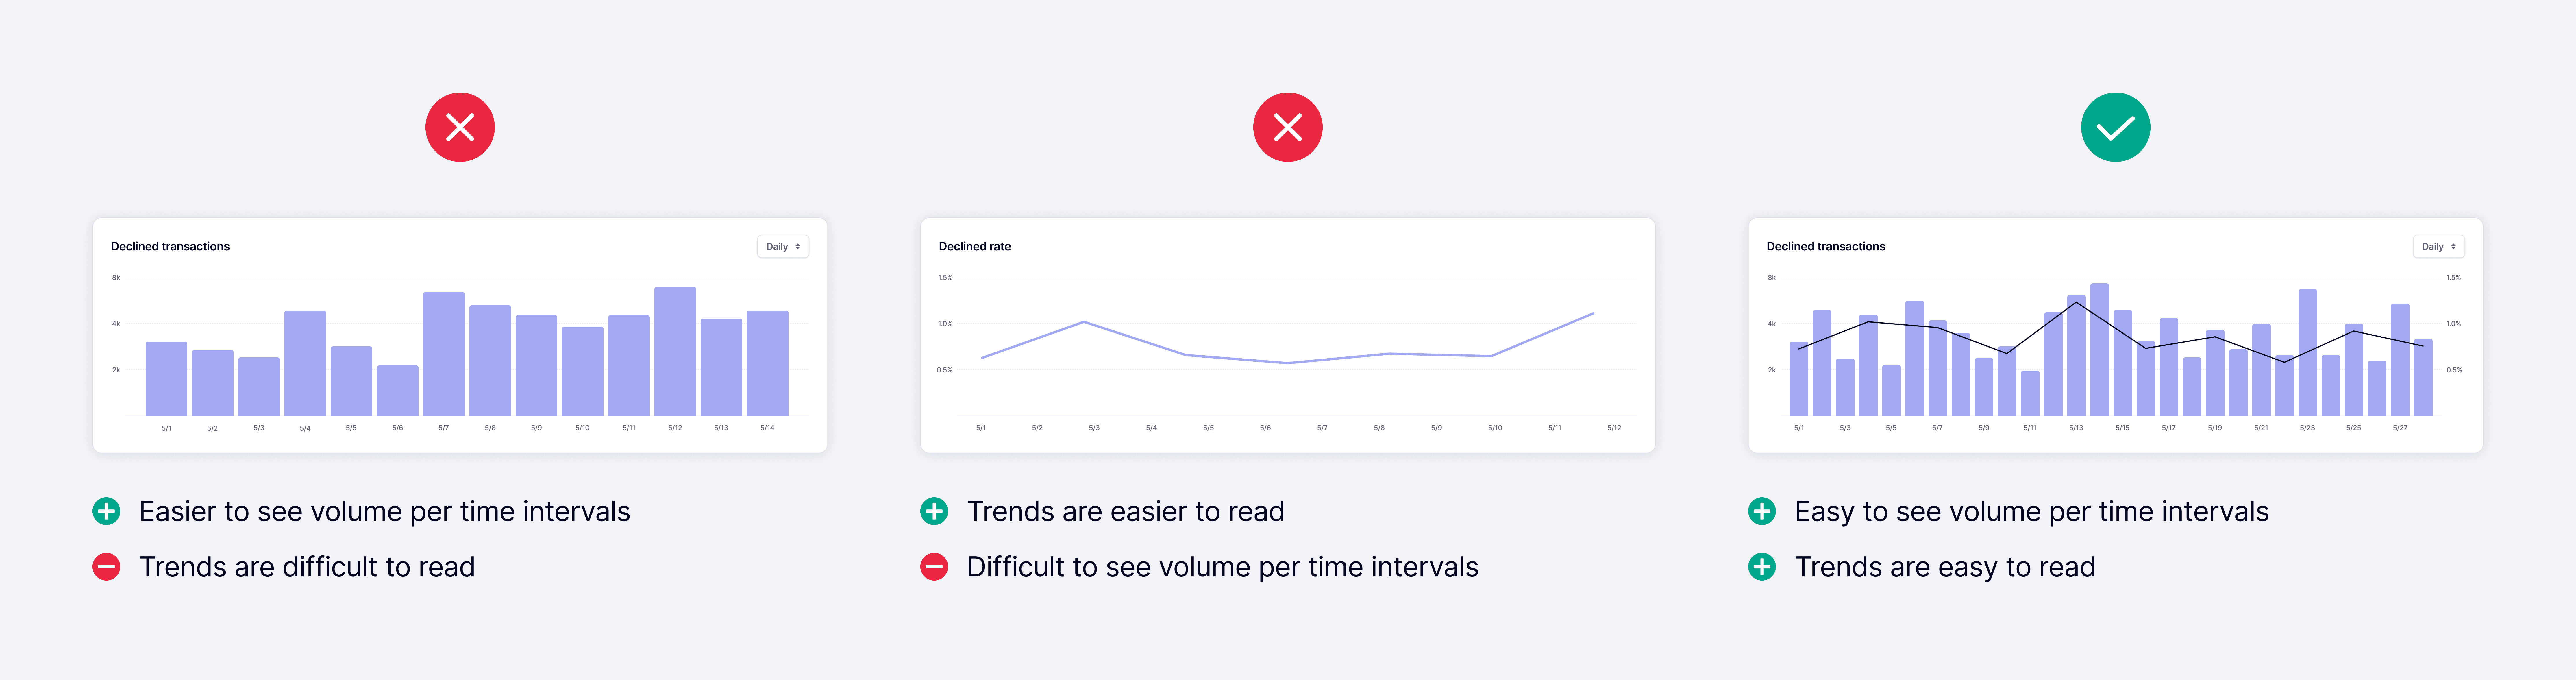
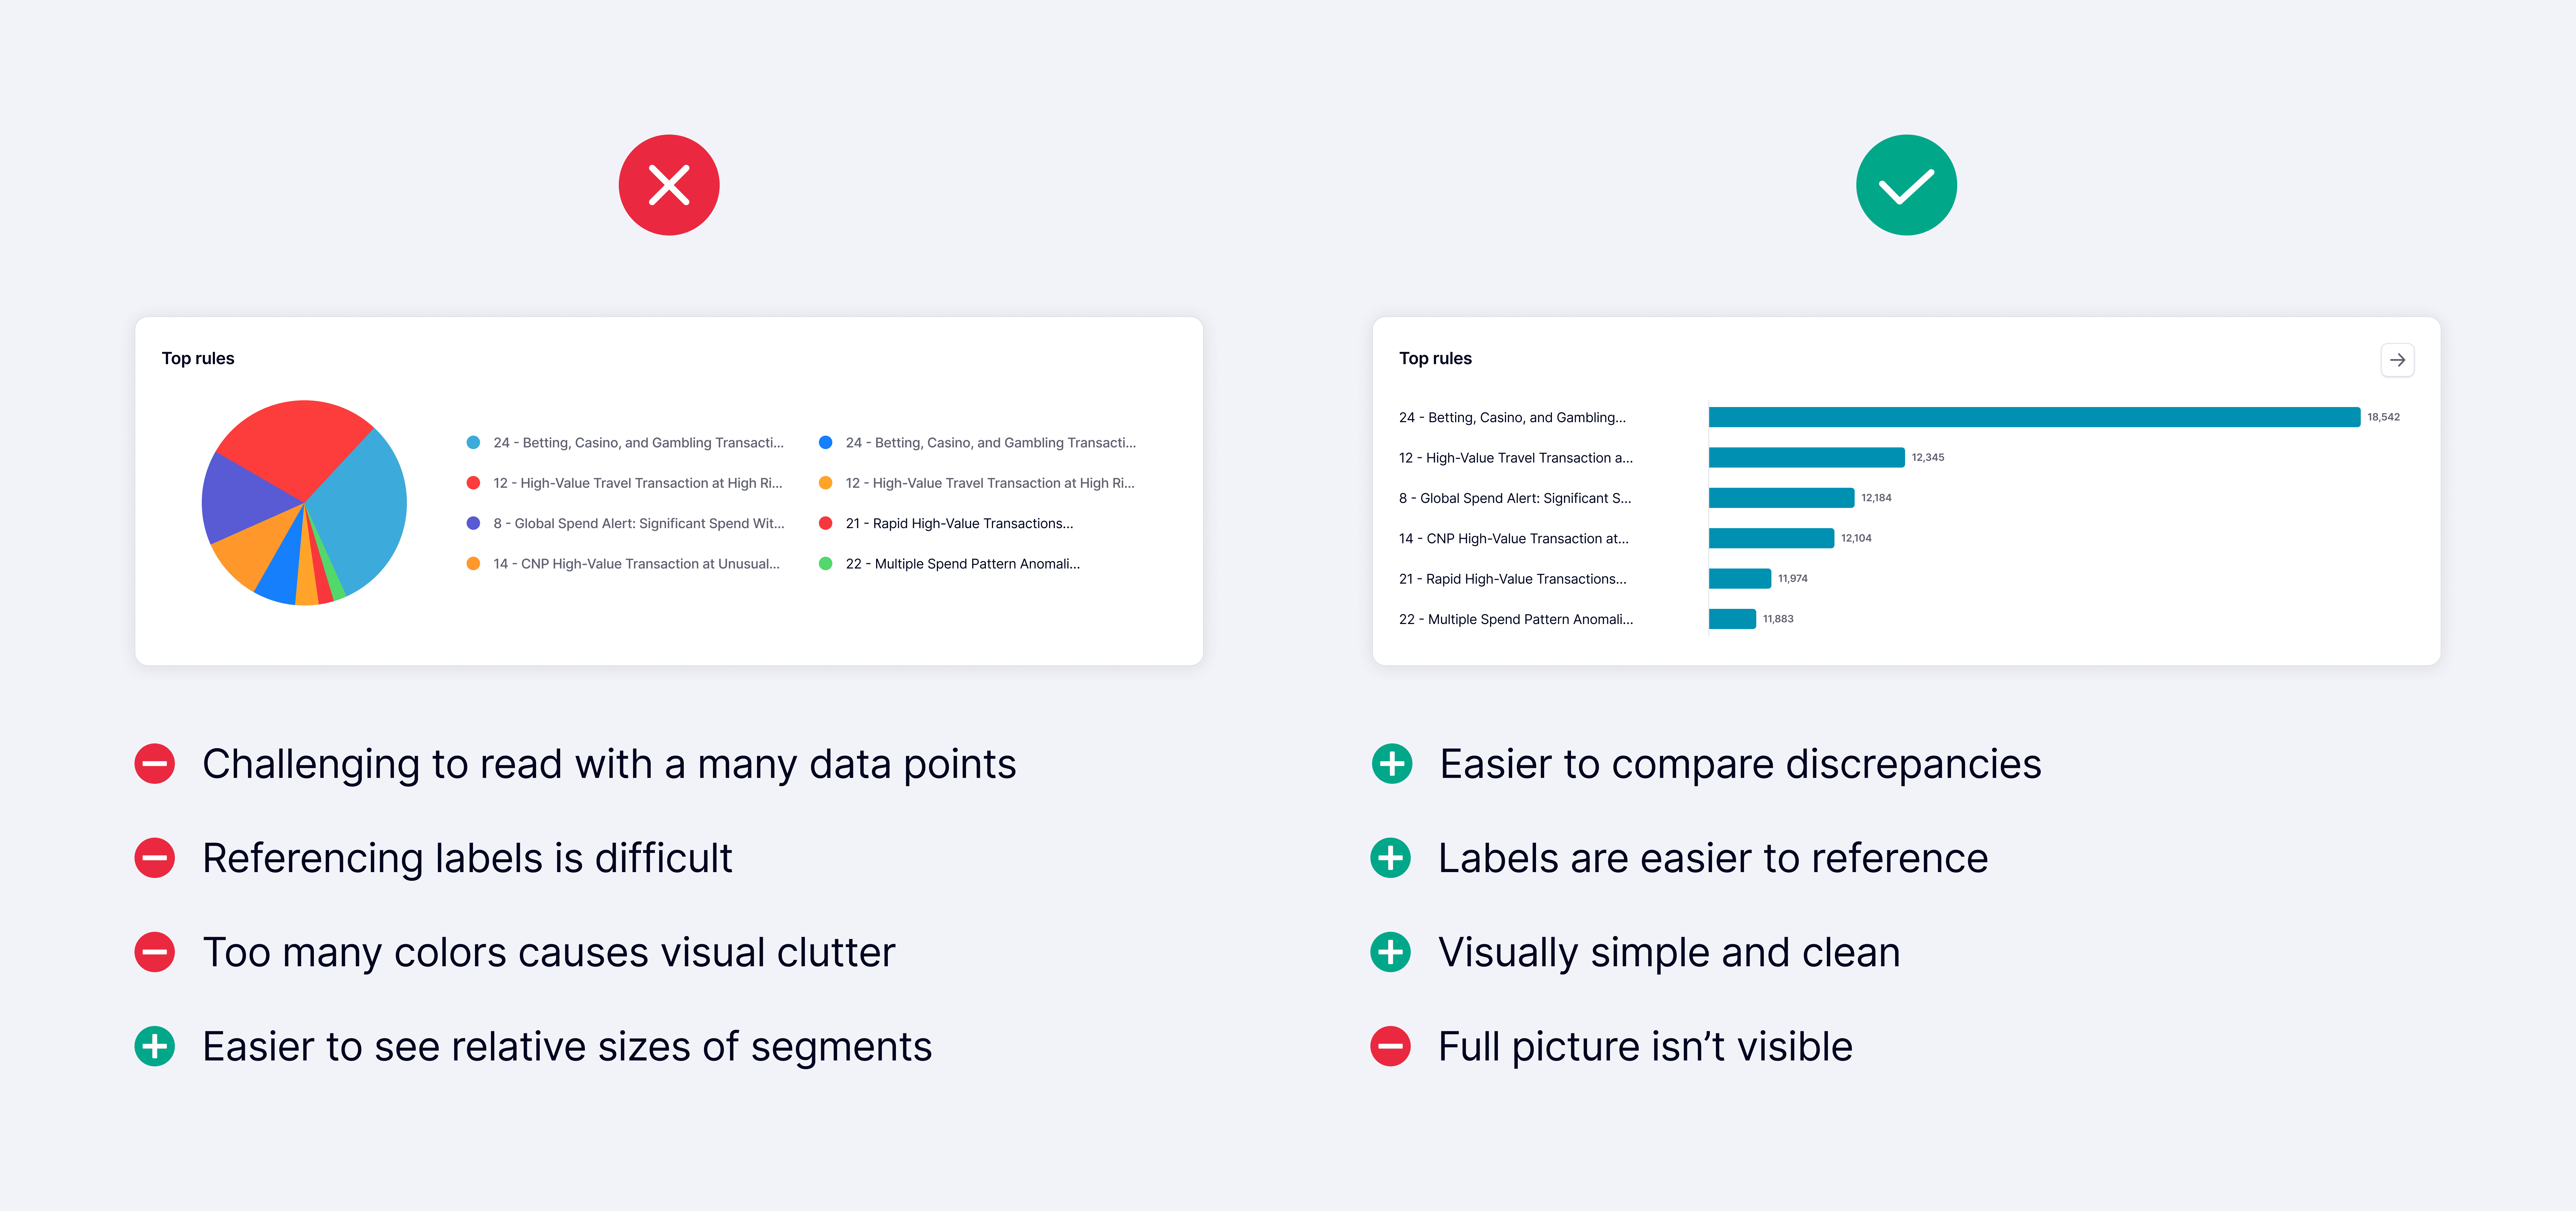
Using data visualizations allowed analysts to quickly spot patterns, avoiding the need to manually sift through raw data. We focused on keeping the visualizations simple and intuitive to enhance clarity and ease of understanding.

Impact
Delivering value quickly to customers
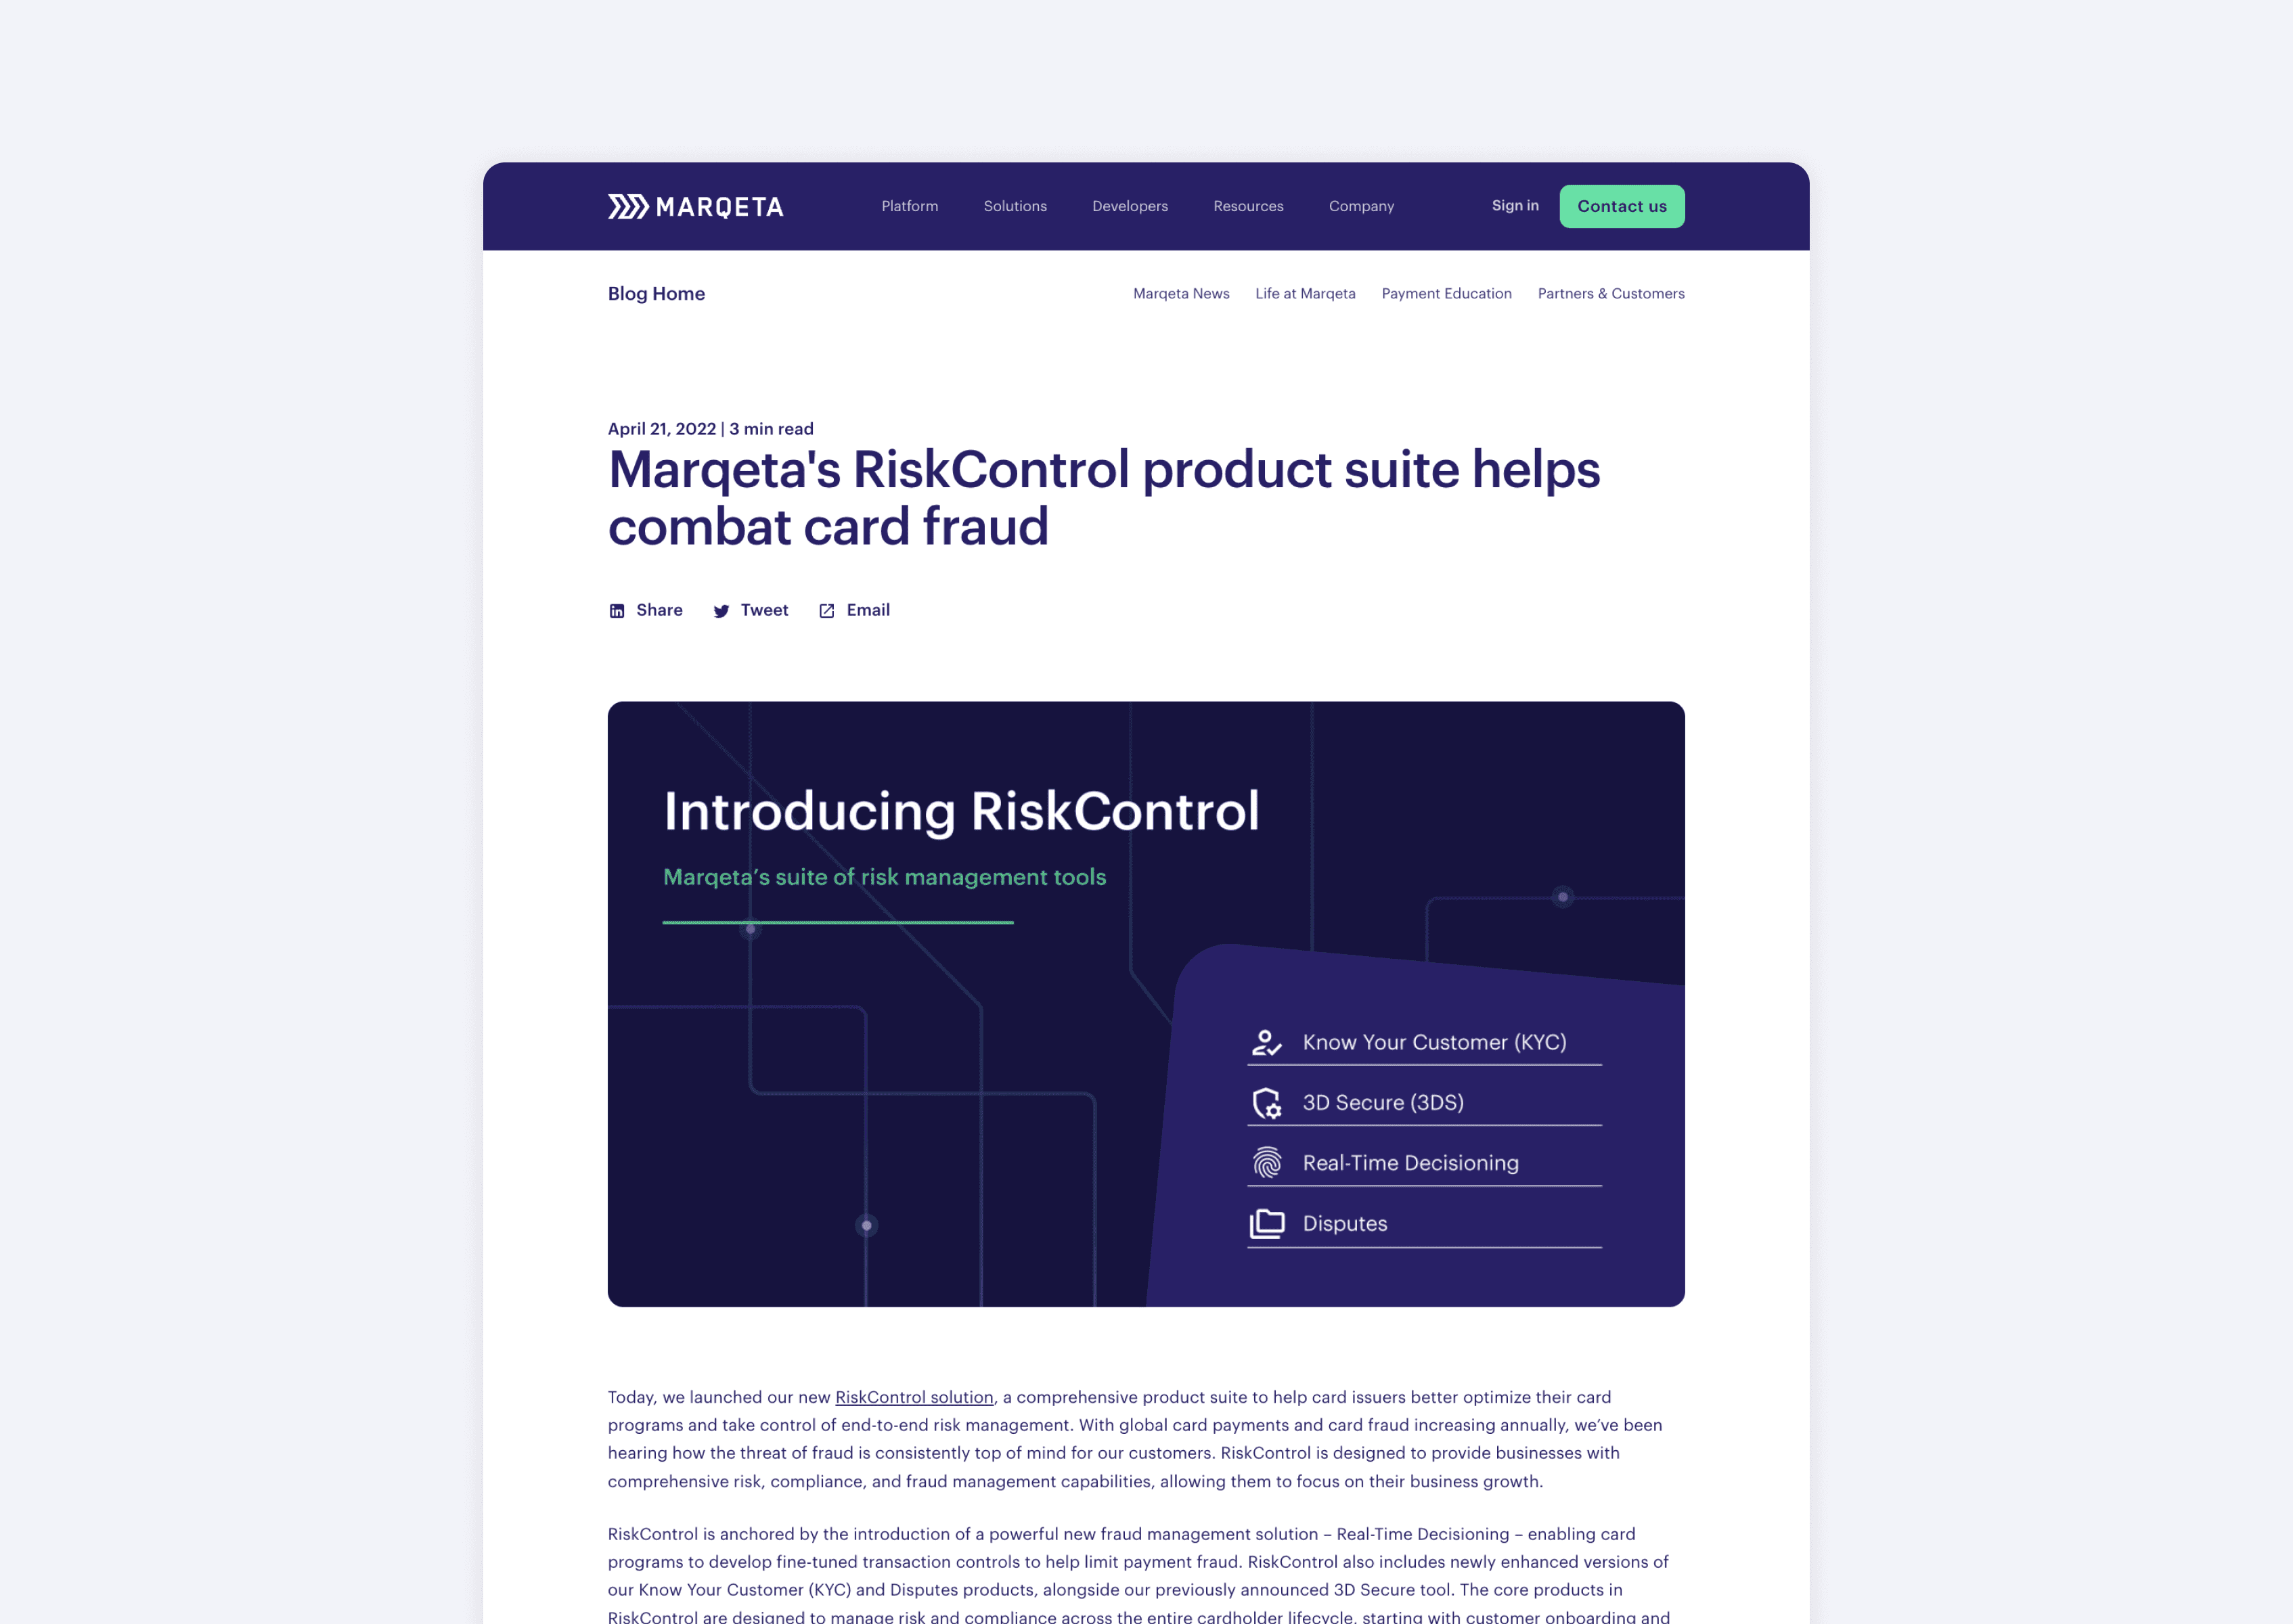
The Transaction Monitoring Dashboard was a key component of the RiskControl product suite that was launched in Q2 2022. It quickly became a valuable tool for customers and helped them understand their data better, while providing them with greater confidence in their decision-making process.

Takeaways
Simple solutions can be effective
During early explorations, we experimented with variations that included more data and metrics on the page. However, after multiple feedback sessions and iterations, the simplest design consistently received the most positive feedback. This experience reinforced the value of simplicity and reminded me that the best solutions aren't always the most complex. Sometimes the greatest impact comes from solving the core problem clearly, rather than overdesigning for the sake of novelty.
Leveraging resources to keep things moving
One challenge throughout this project was gathering timely design feedback from customers. Since external users had demanding schedules, it was often difficult to coordinate research sessions. This was also a relatively lightweight initiative so many design decisions only required quick validation and didn't warrant scheduling formal interviews.
To address this, I regularly partnered with Marqeta's internal risk analysts and gathered feedback through quick Slack huddles and informal chats. By building strong relationships with these SMEs, I was able to validate ideas quickly and receive more candid feedback throughout the process.
This experience reinforced that valuable feedback doesn't always need to come through formal research. Building strong relationships across teams can be just as valuable, creating a continuous feedback loop that accelerates decision-making and keeps projects moving forward.