Risk Profiles
Senior Product Designer
2023
Background
Fraud management tools were in demand
This was a frequently asked question by both current and prospective customers of Marqeta.

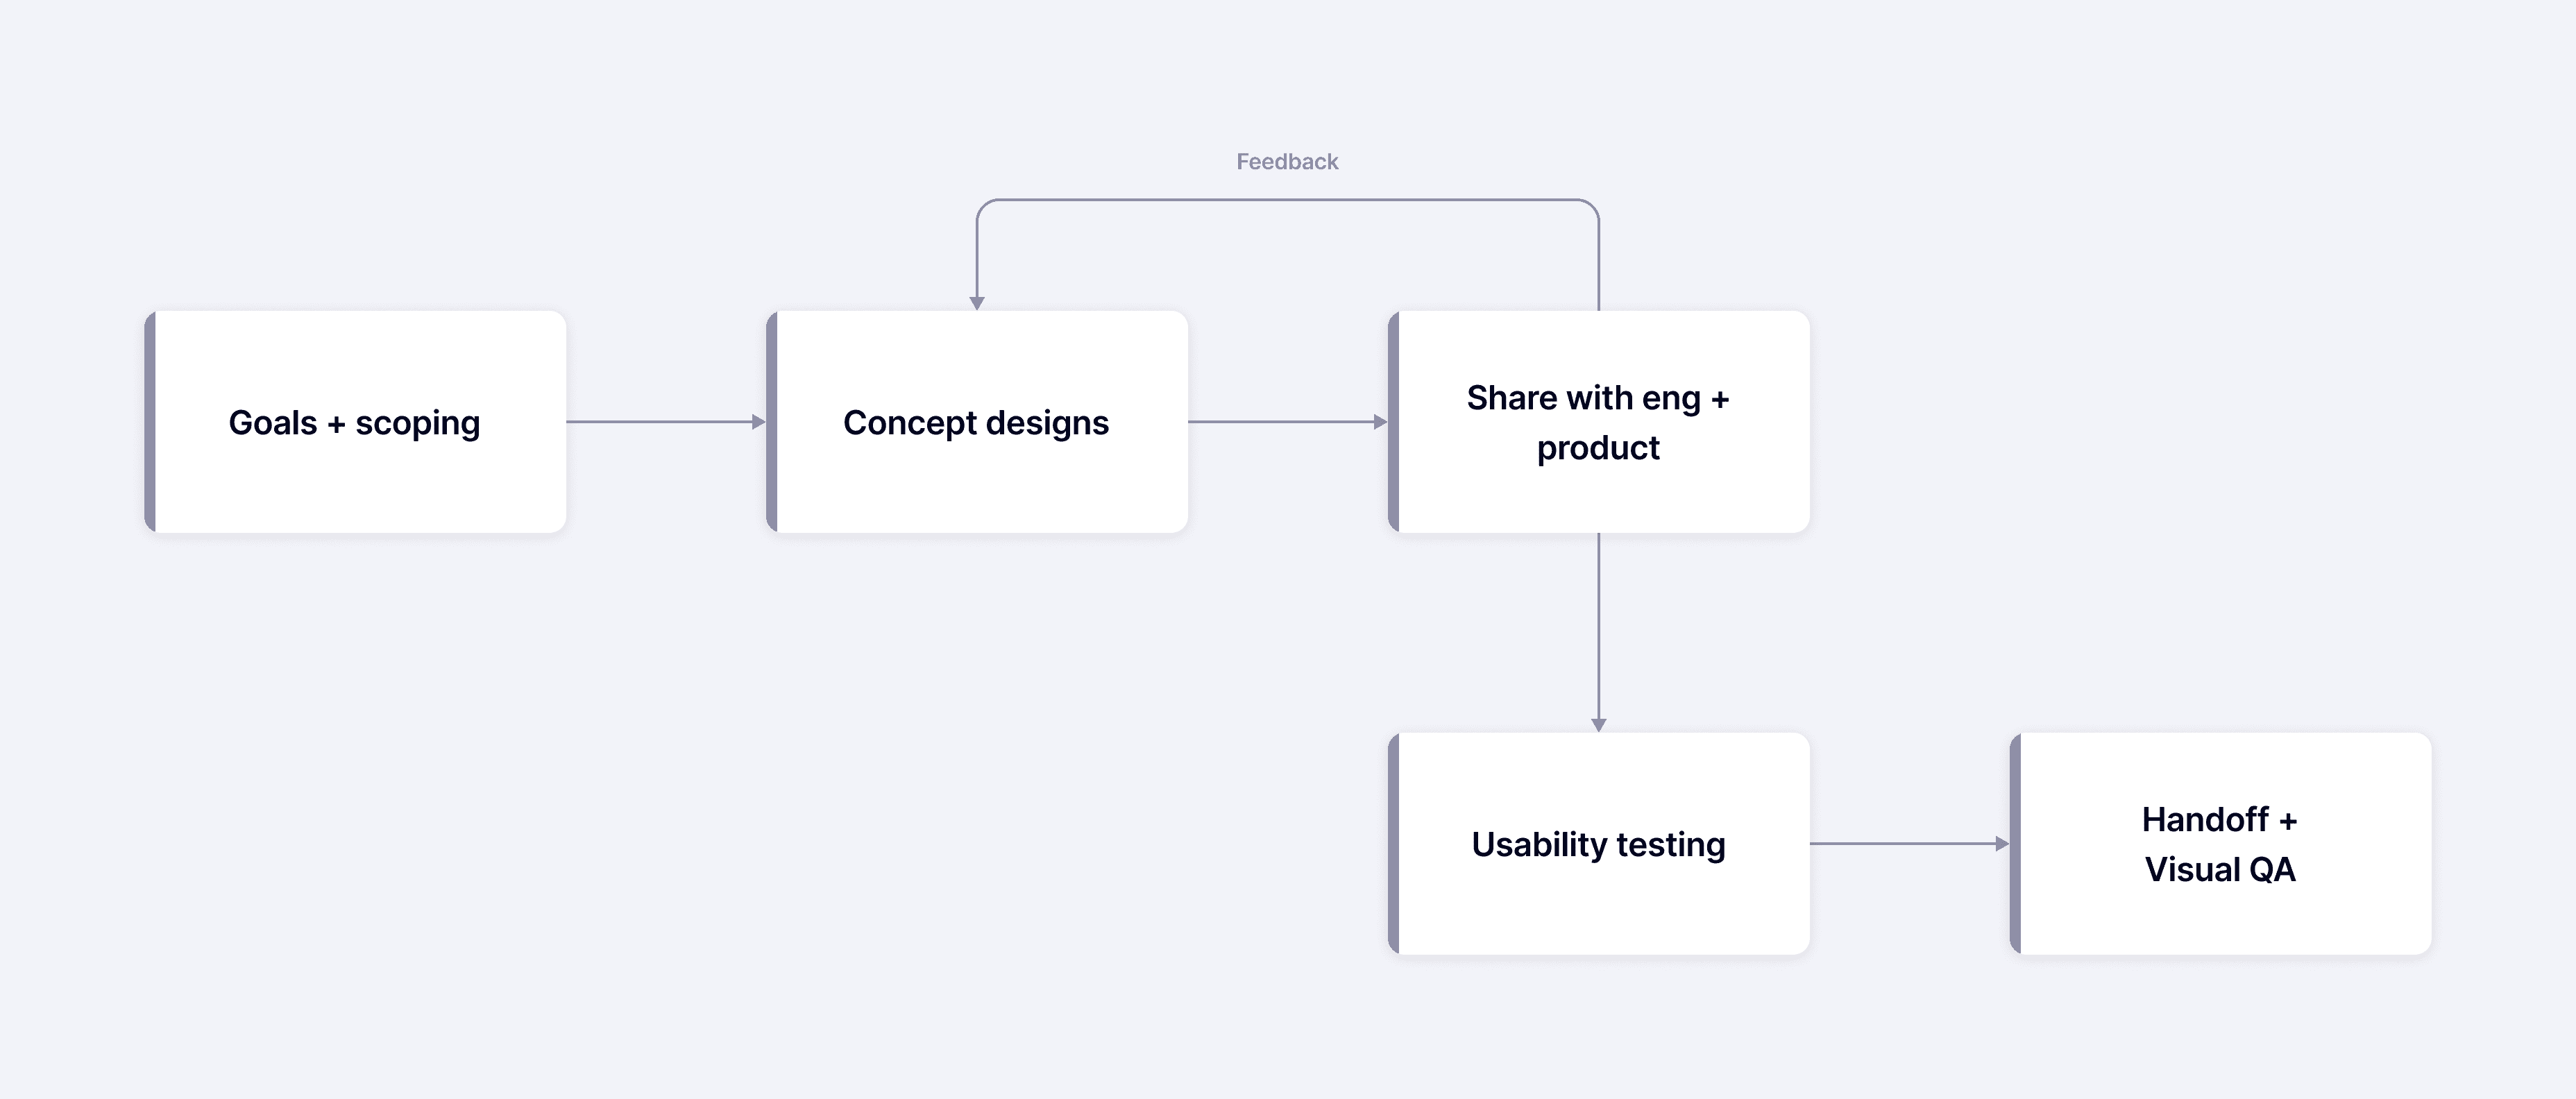
The following dashboard was designed to give risk operations teams clearer insights into their data, enabling them to make more informed decisions. As the lead designer on this project, I worked with a PM, a team of engineers, and data scientists to ensure the successful launch for this tool.
👥 Team
I worked in a cross-functional squad, with 1 PM, 2 front-end engineers, and 1 data scientist.
💼 Role
I was the sole designer on this project and was responsible for end-to-end design from user research to handoff.
Problem
Risk profiles had no details to investigate
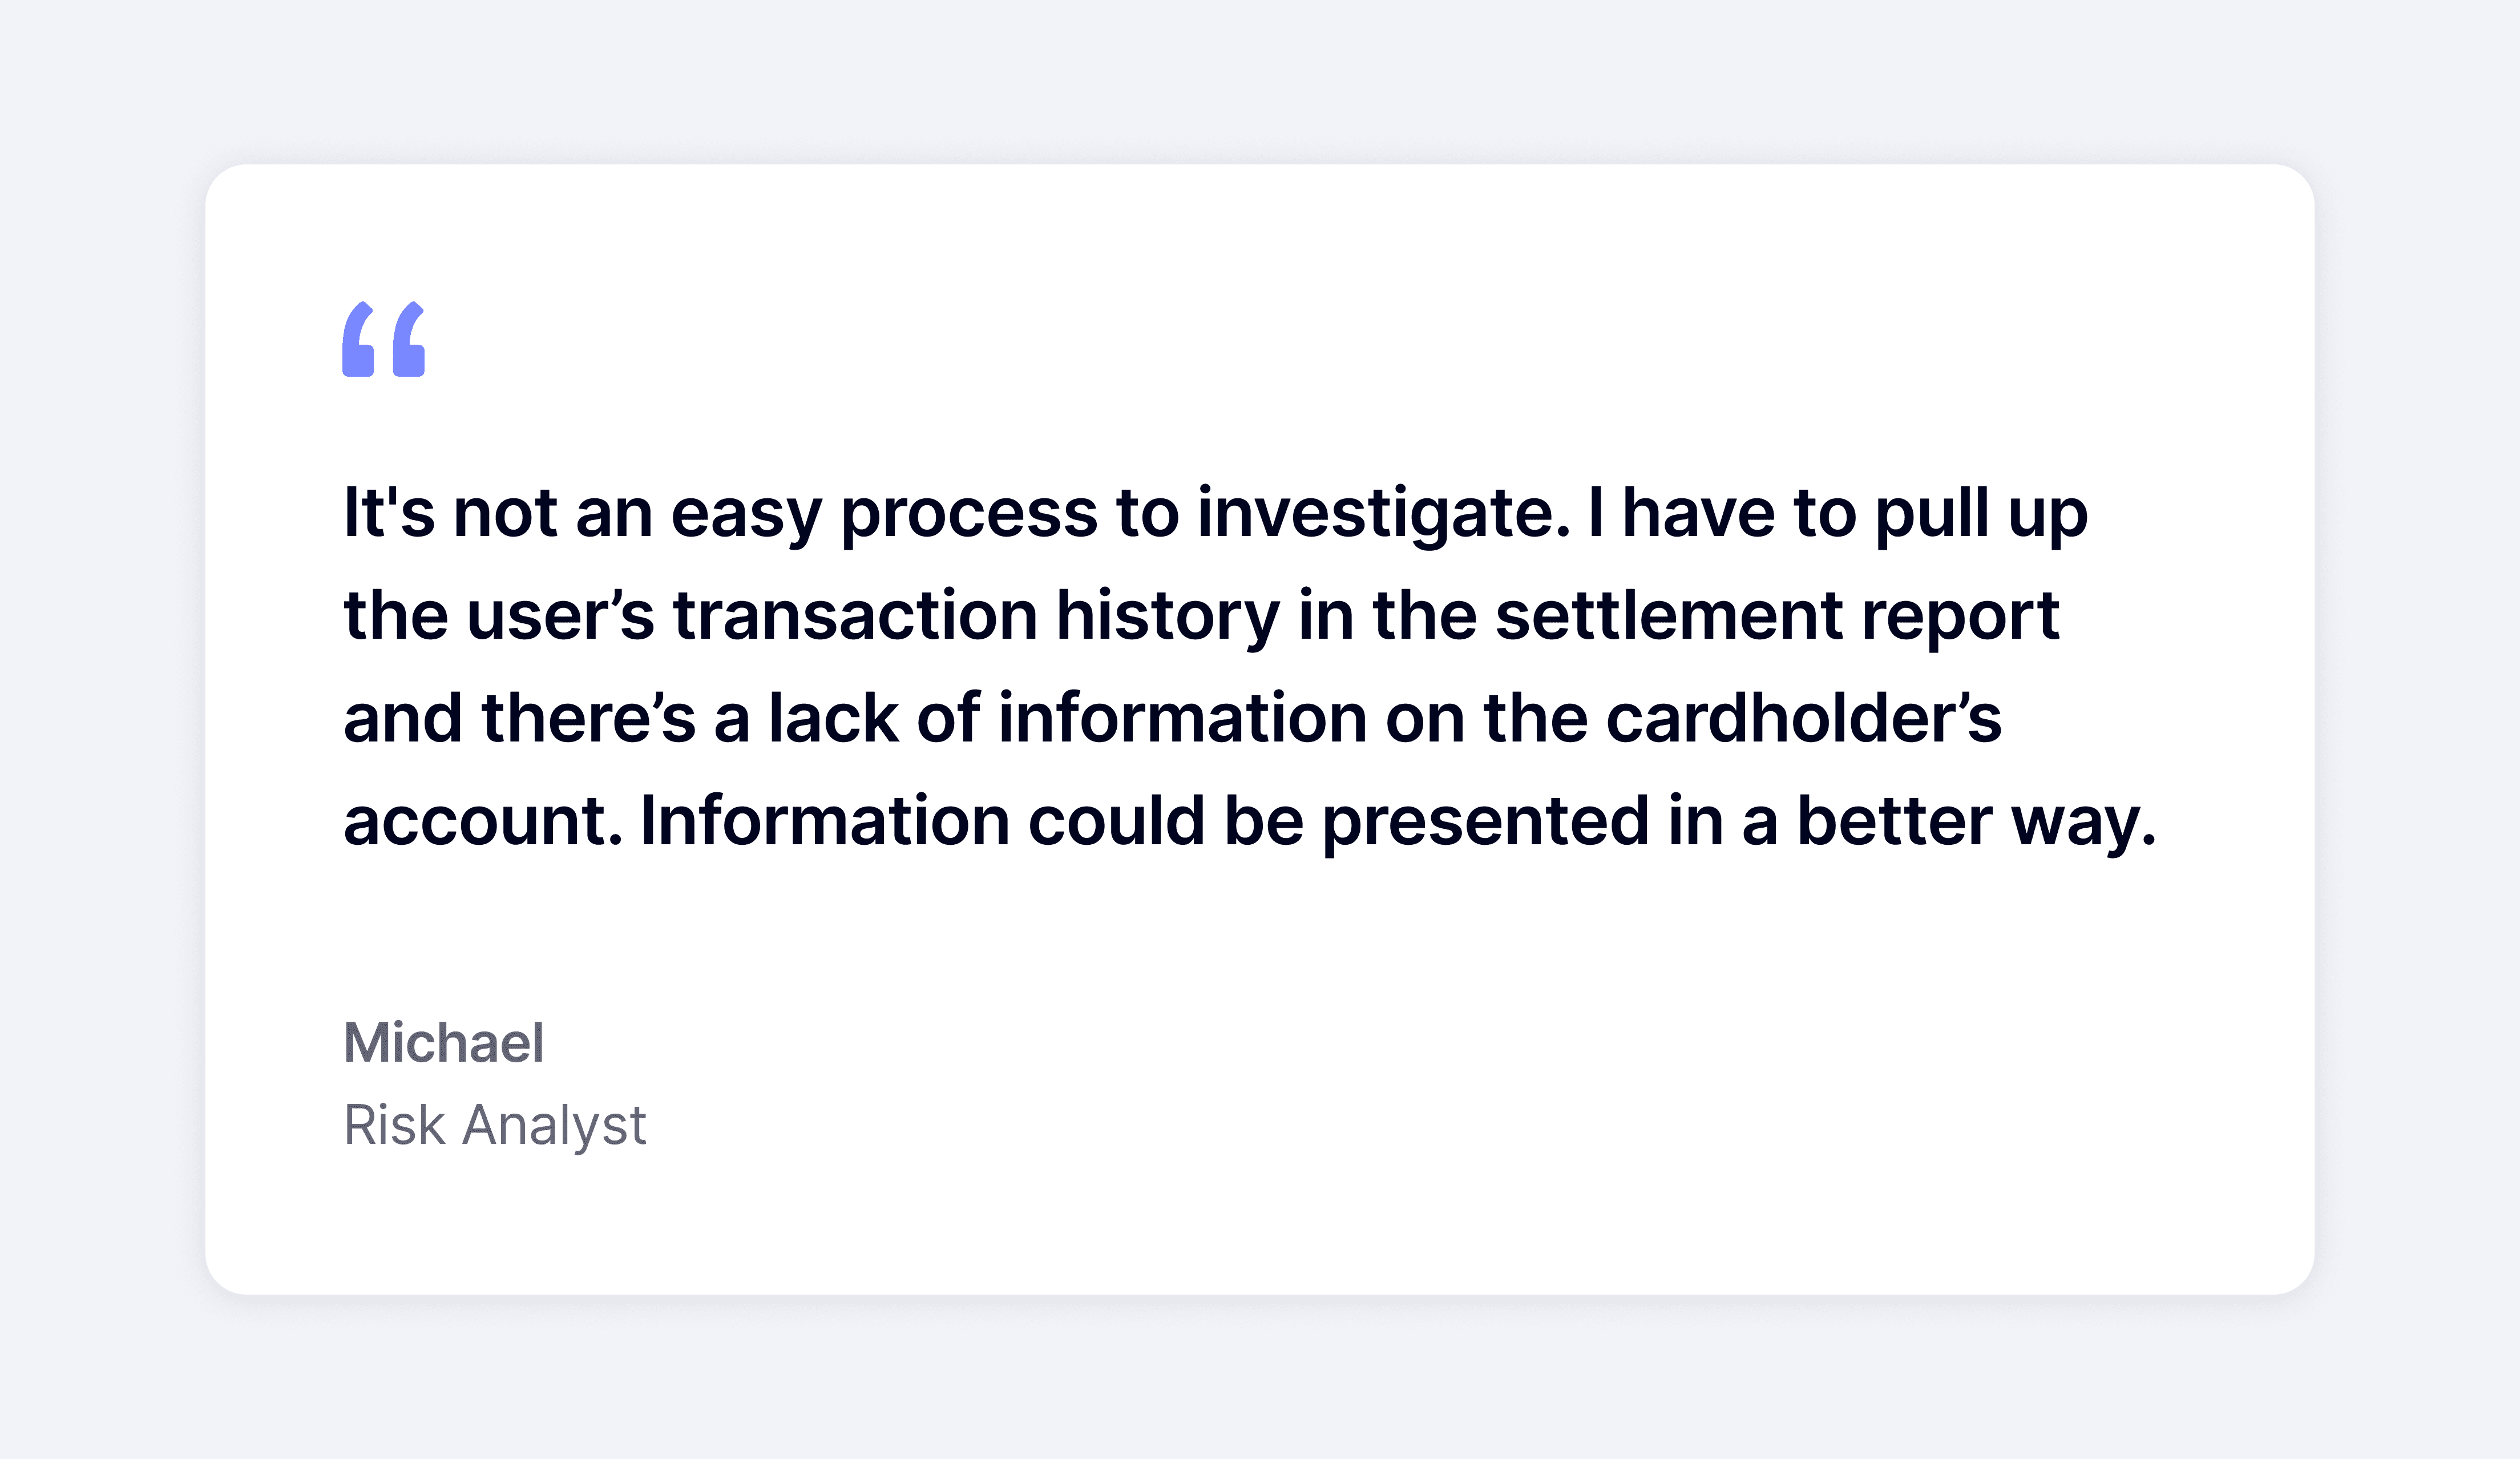
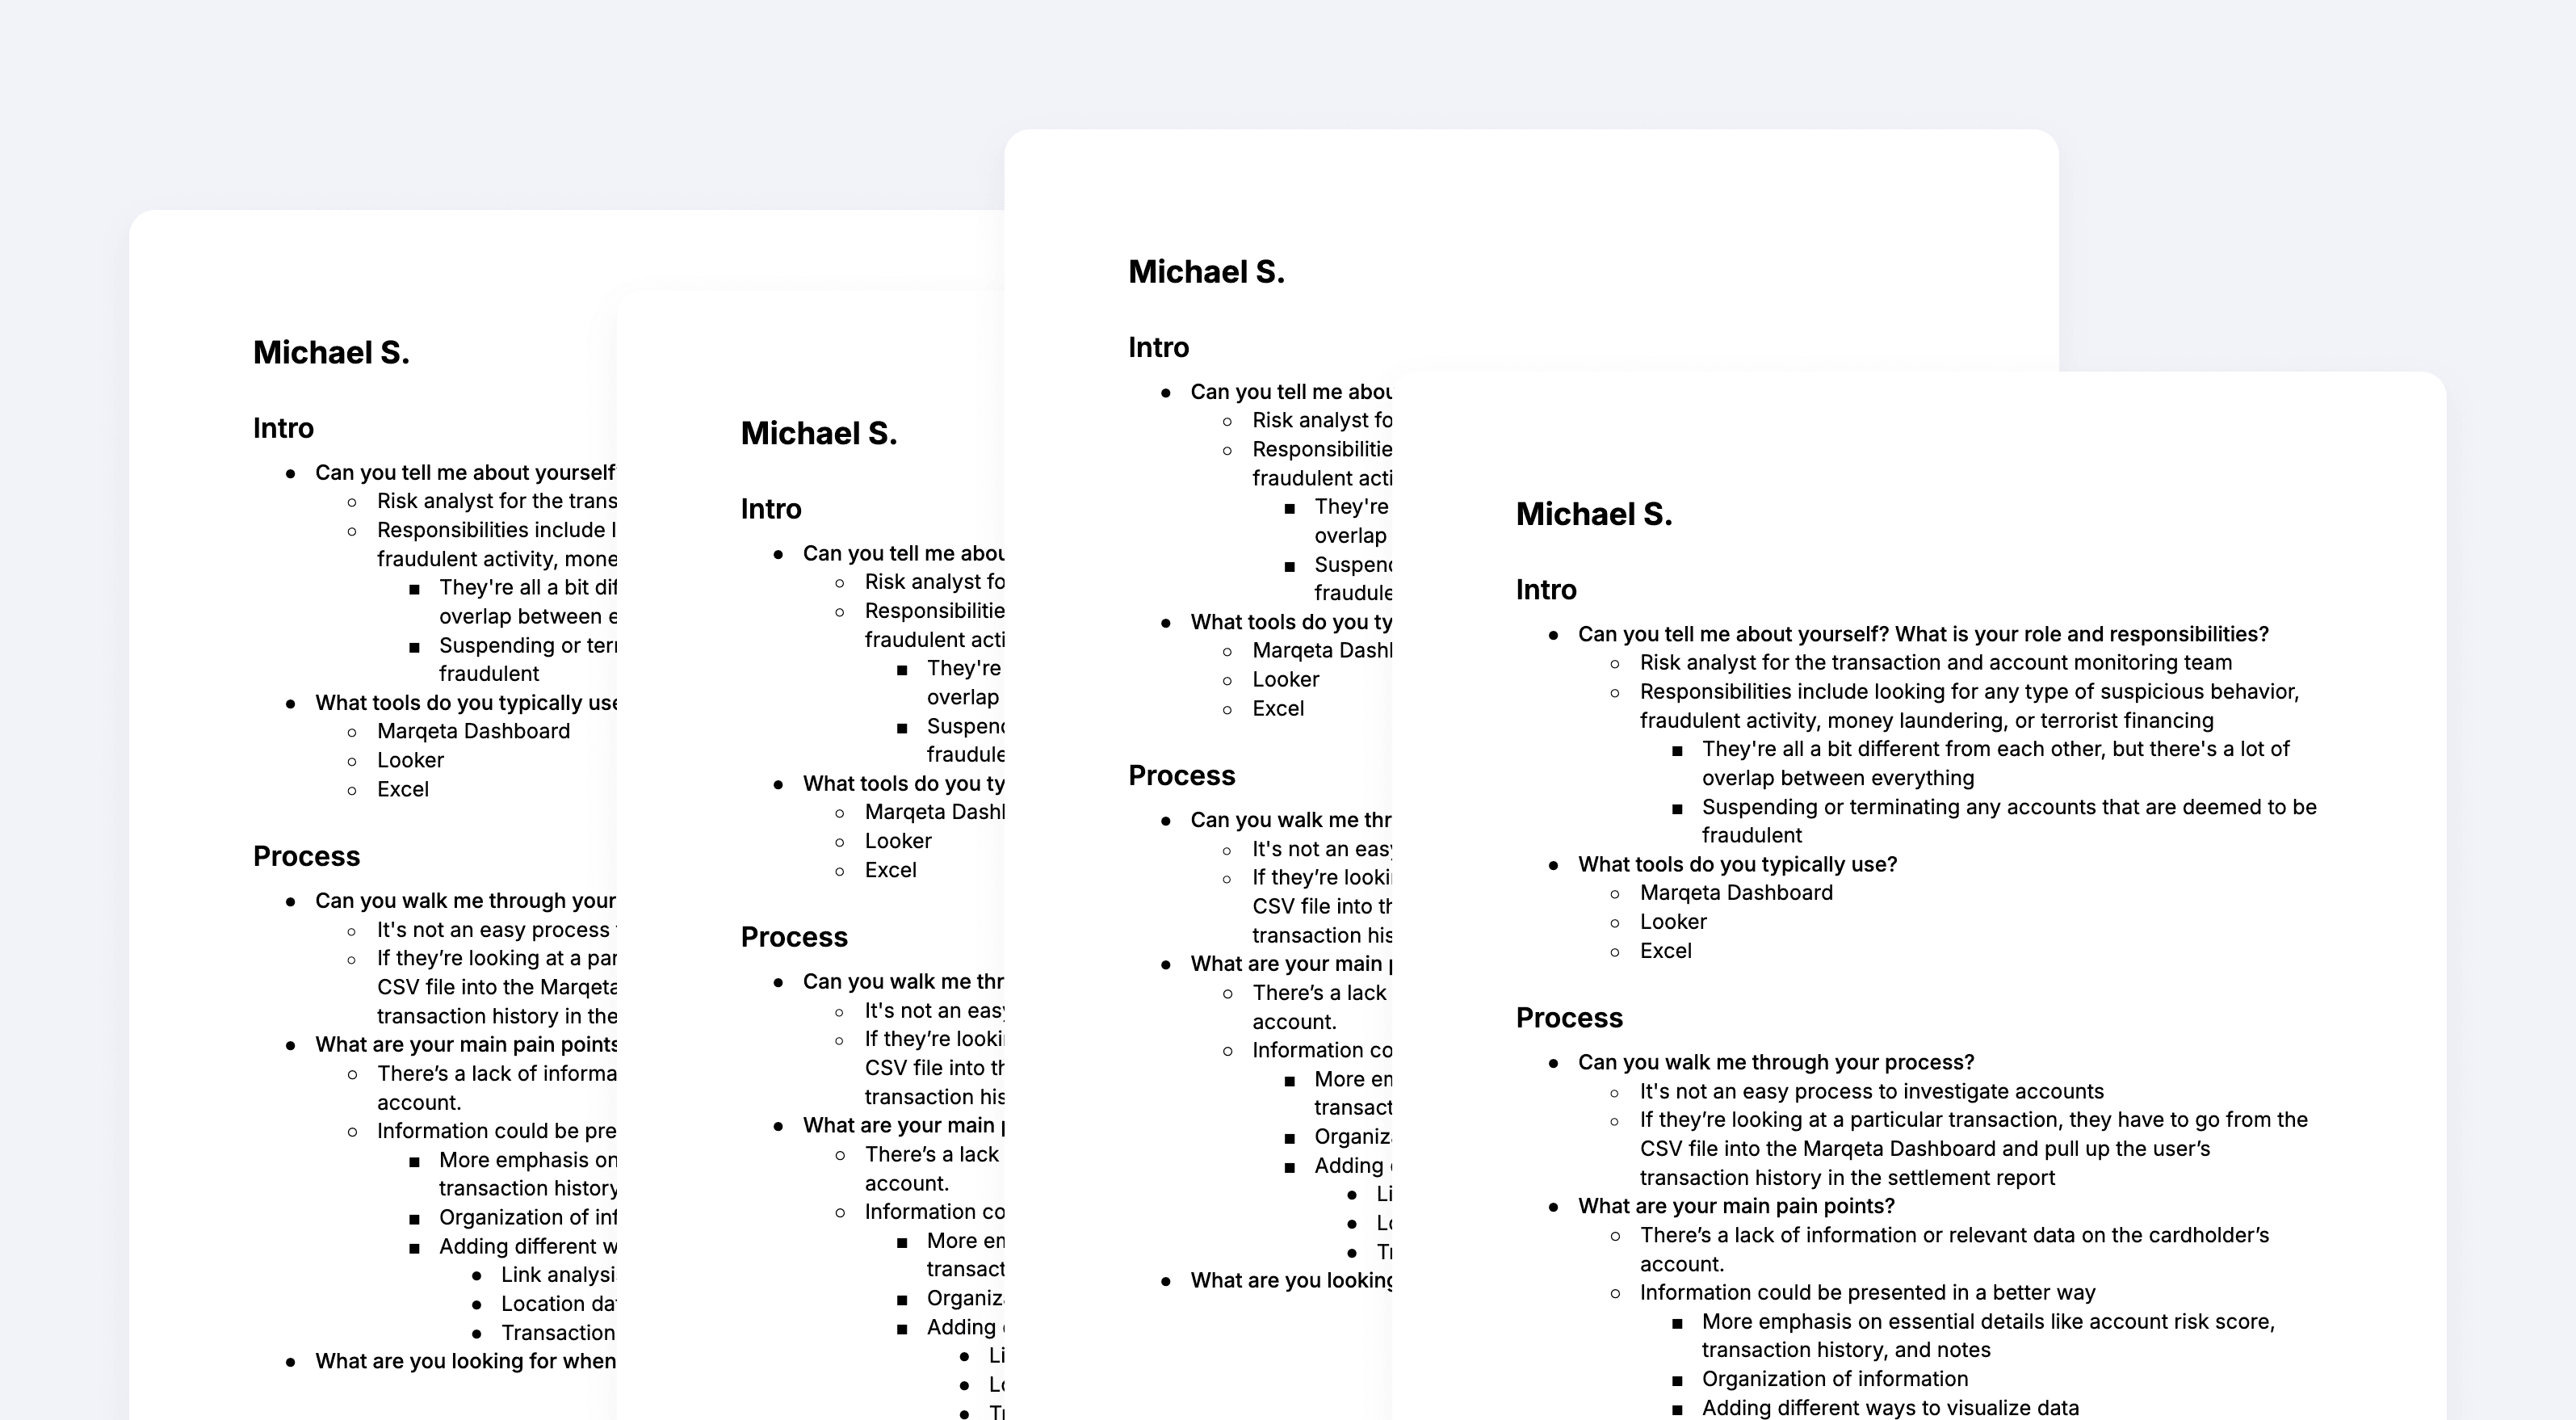
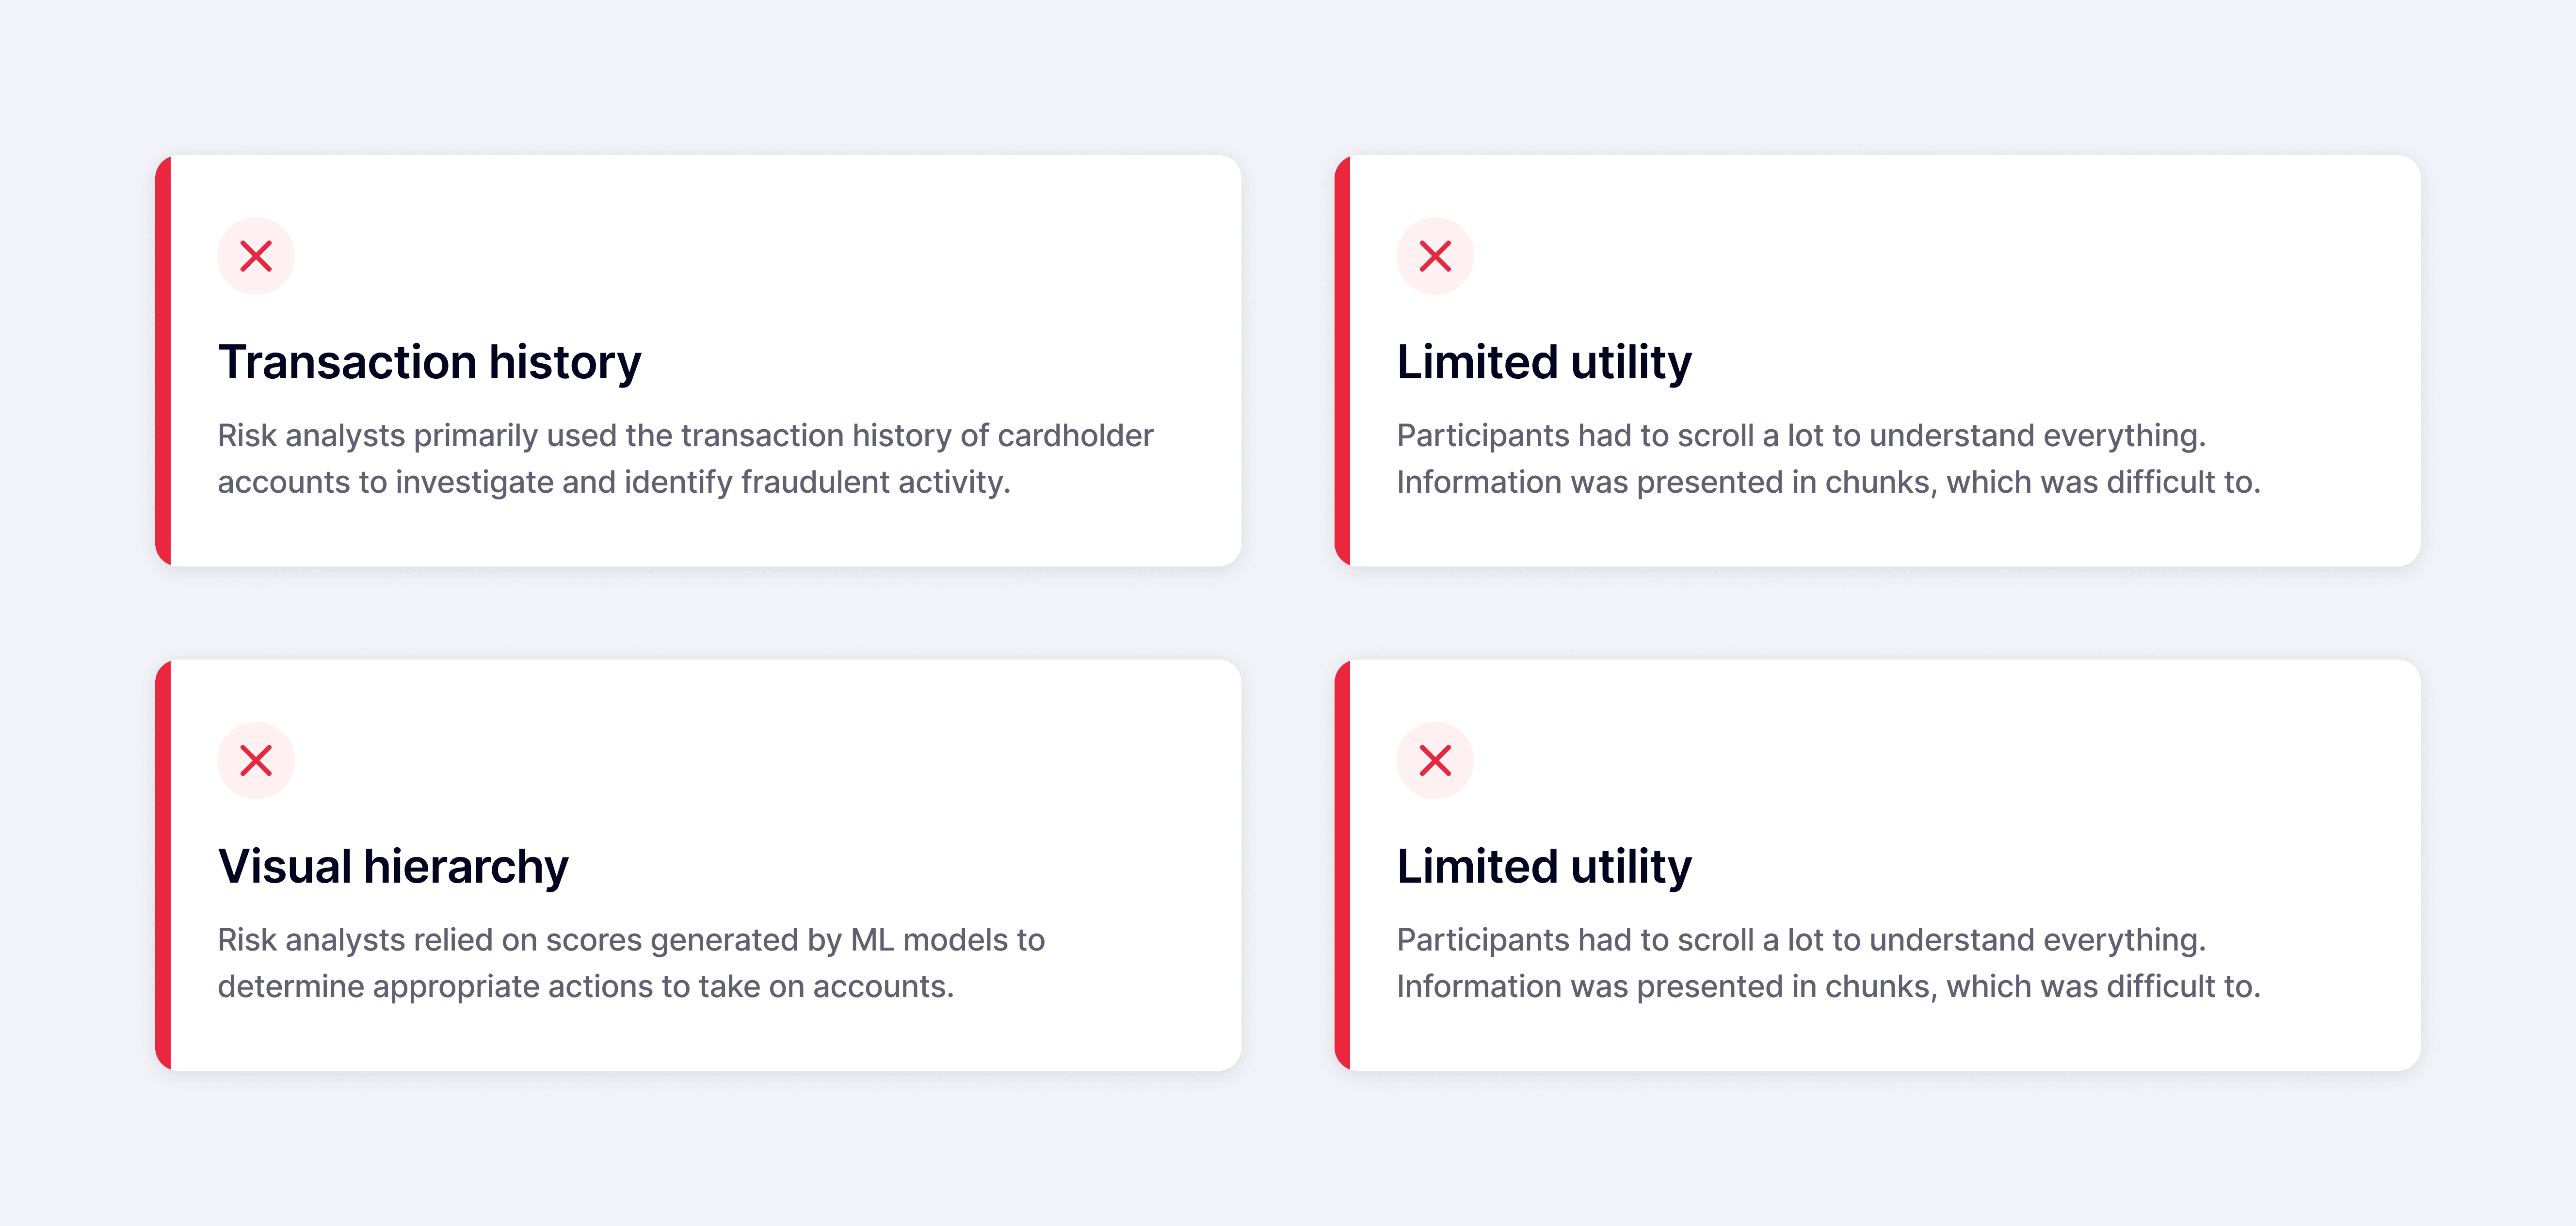
At the time, risk analysts of Marqeta’s customers were using a third-party rules management service within the Marqeta Dashboard to create rules that flagged and declined suspicious transactions.

Research
Providing analysts with insights to make more informed adjustments
Goals
Providing analysts with insights to make more informed adjustments
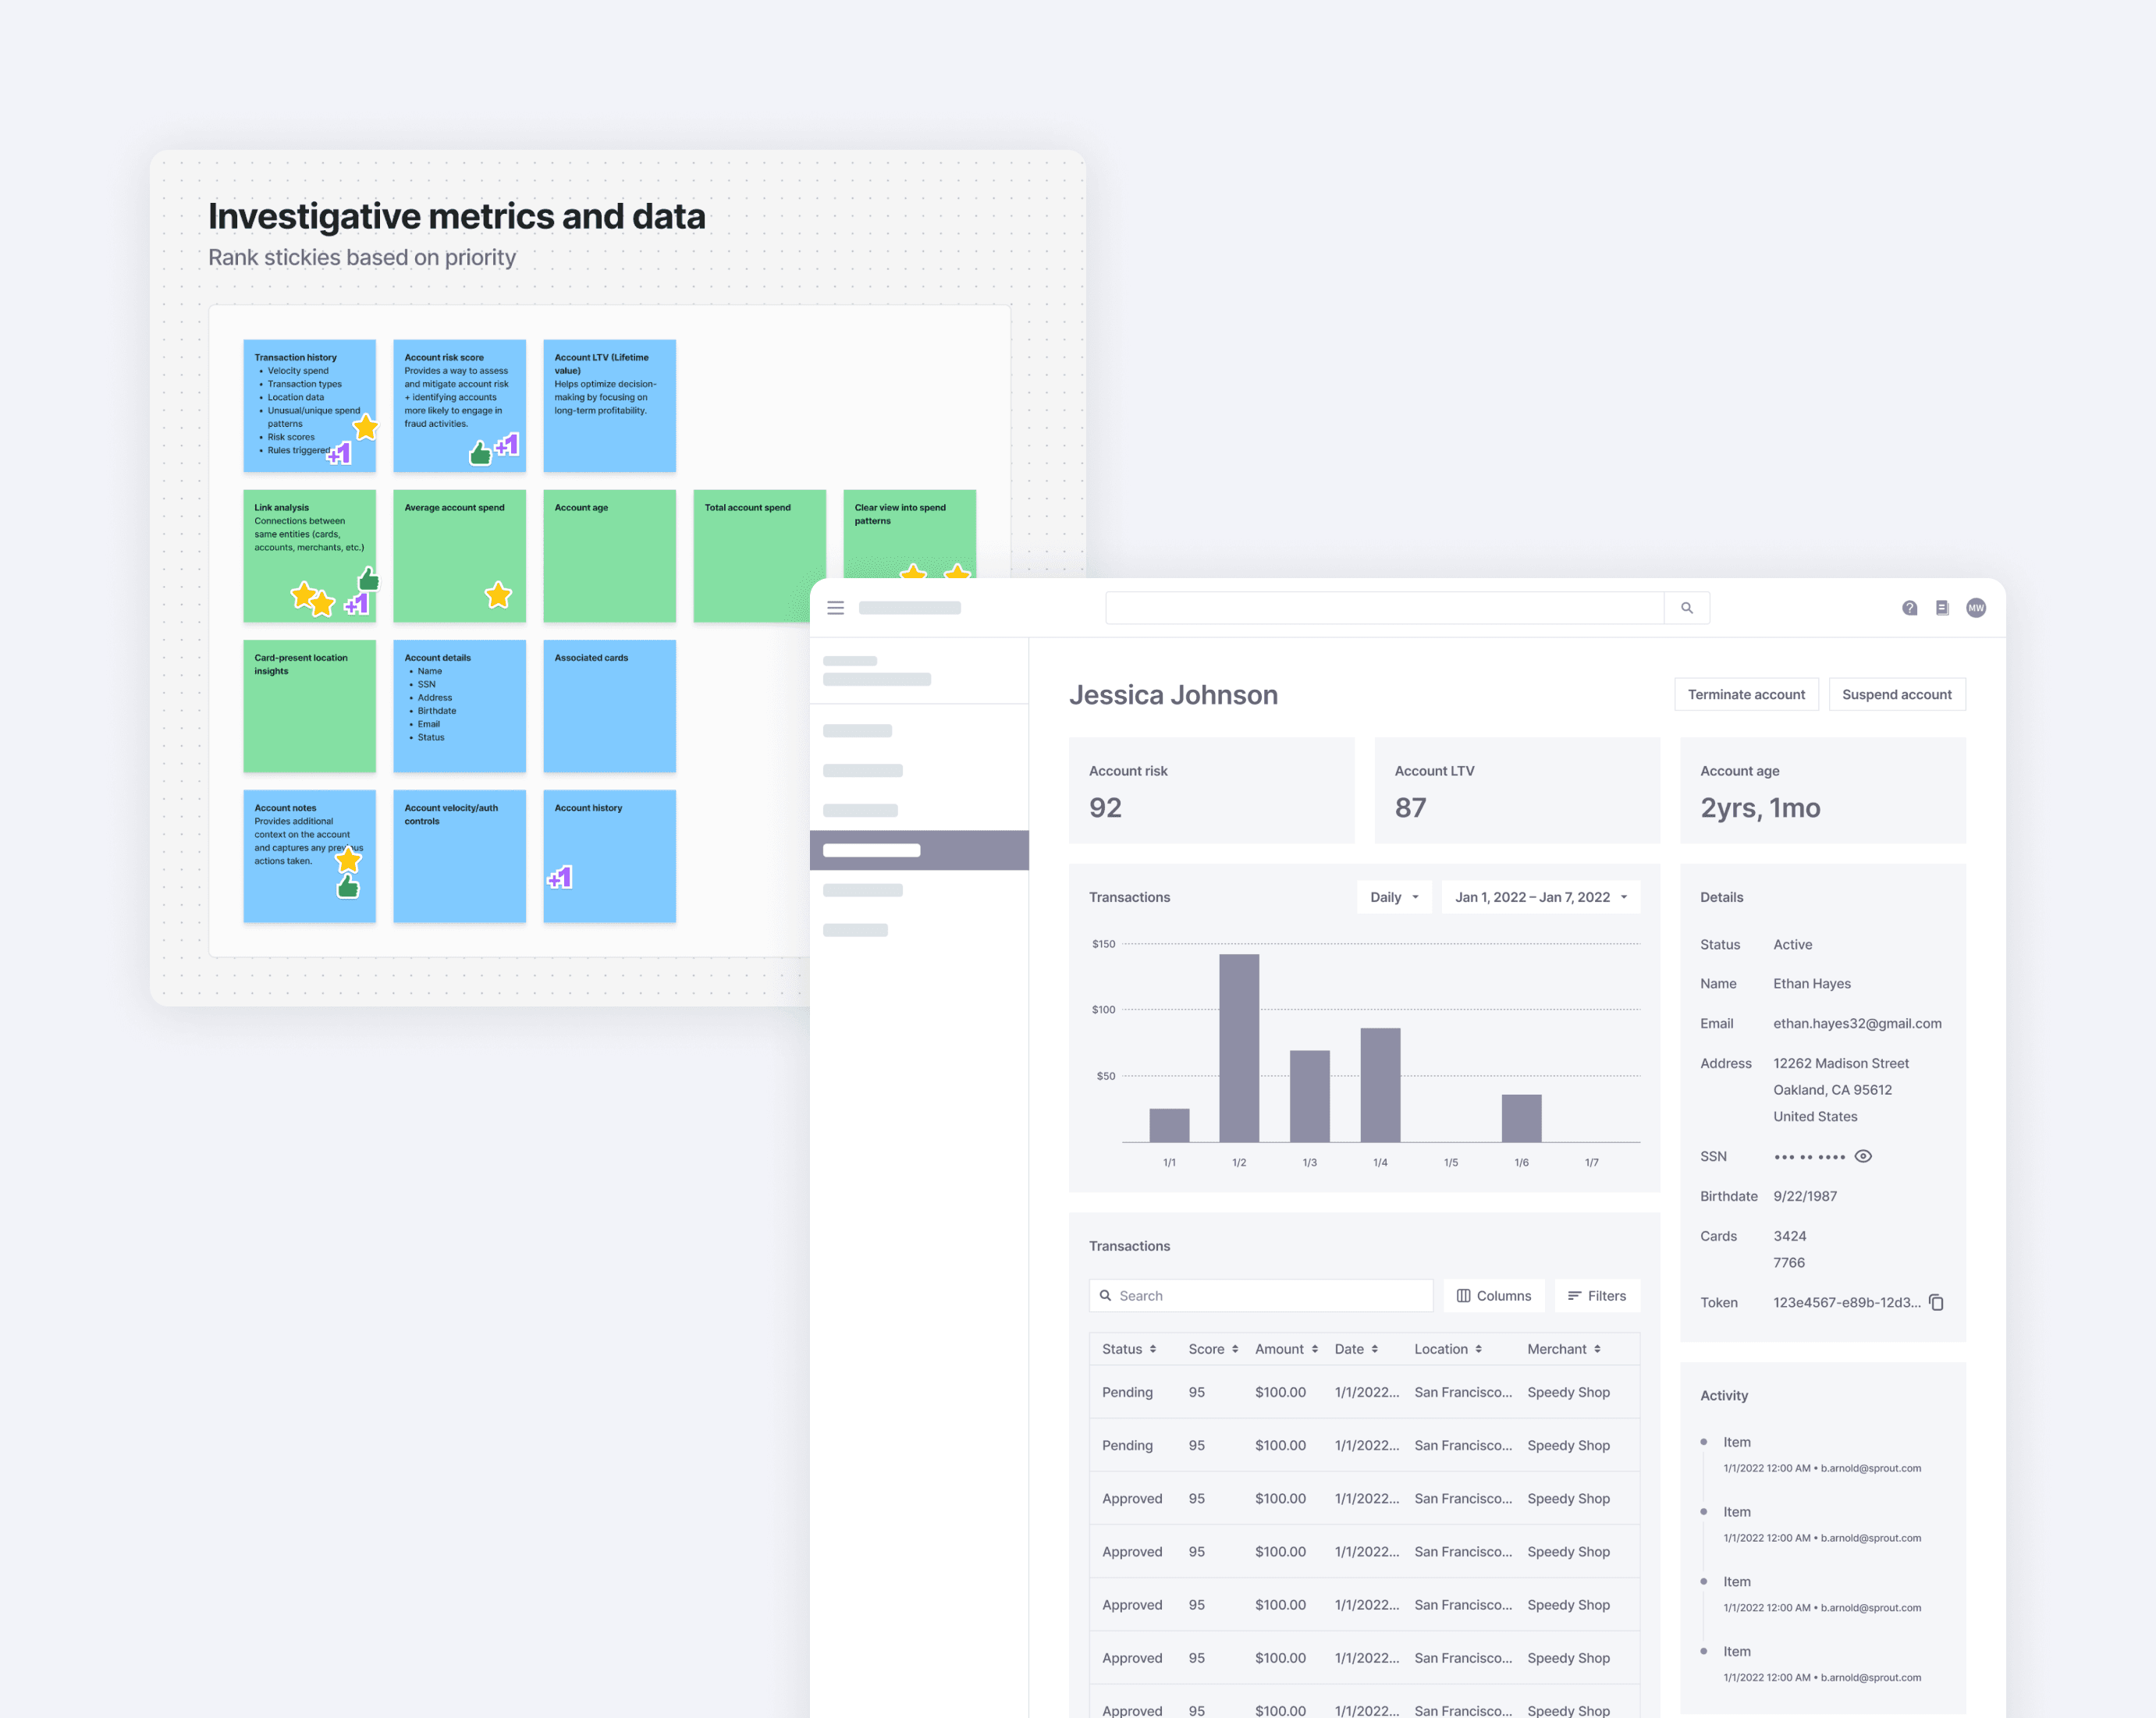
An account investigation system was needed, but keeping the scope smaller, we focused on the account aspect.
Explorations
Lo-fi designs

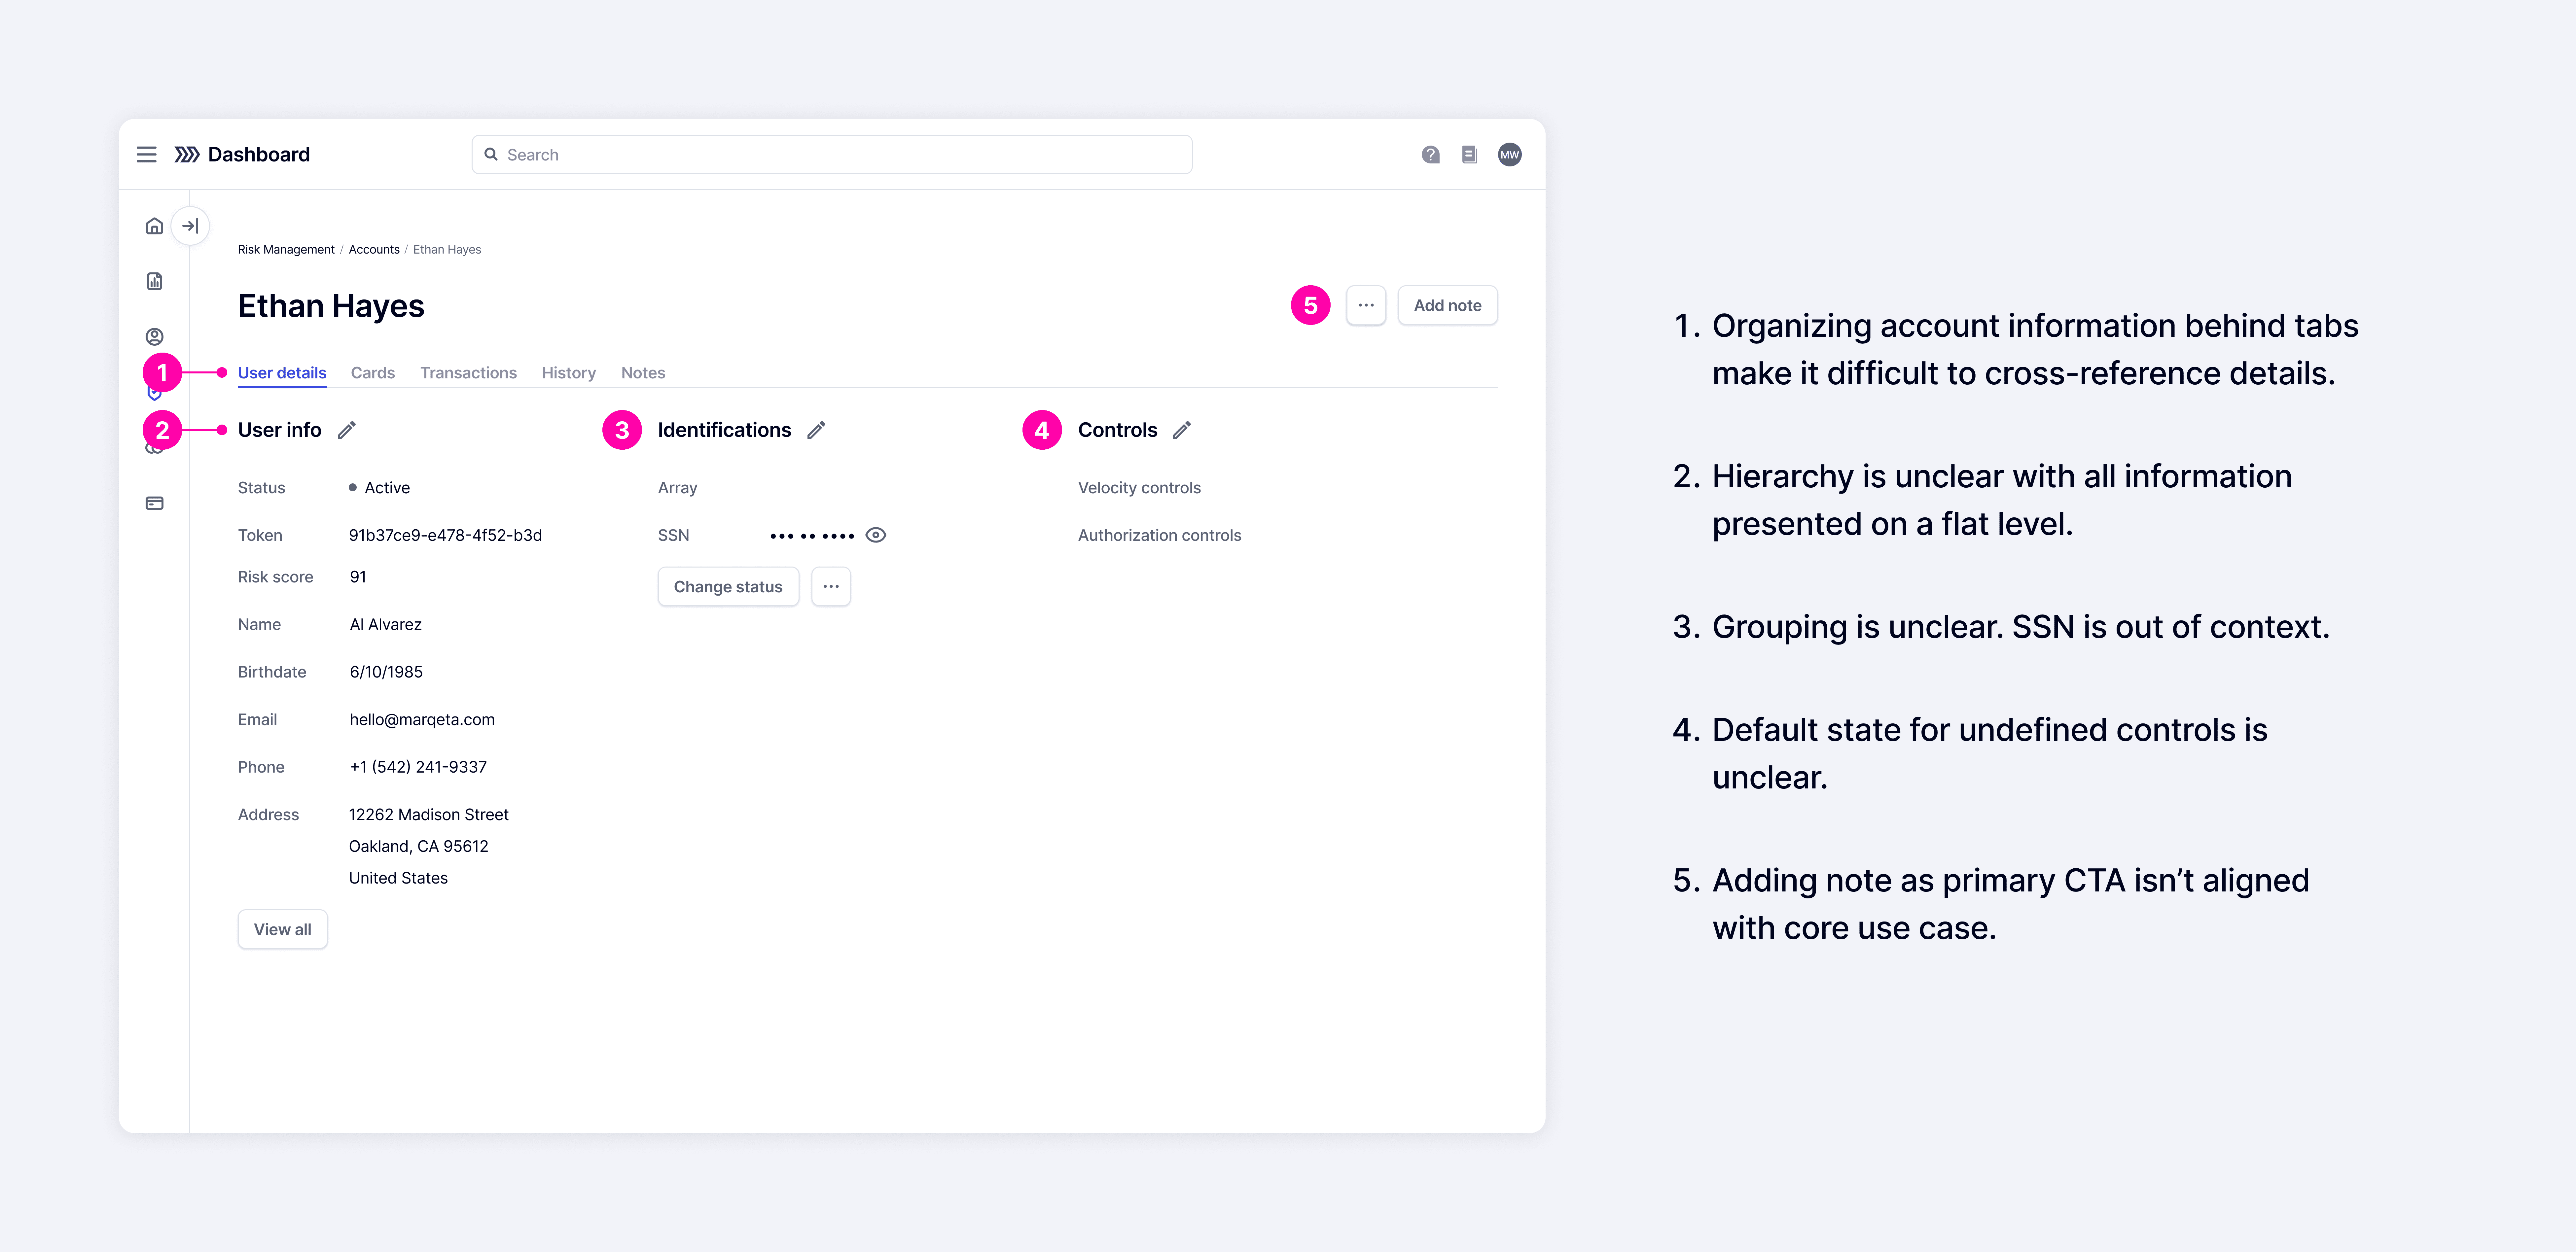
Updates
Updates
Can't do link analysis from engineering
Dismiss account (Ignore)
Request verification
Final Designs
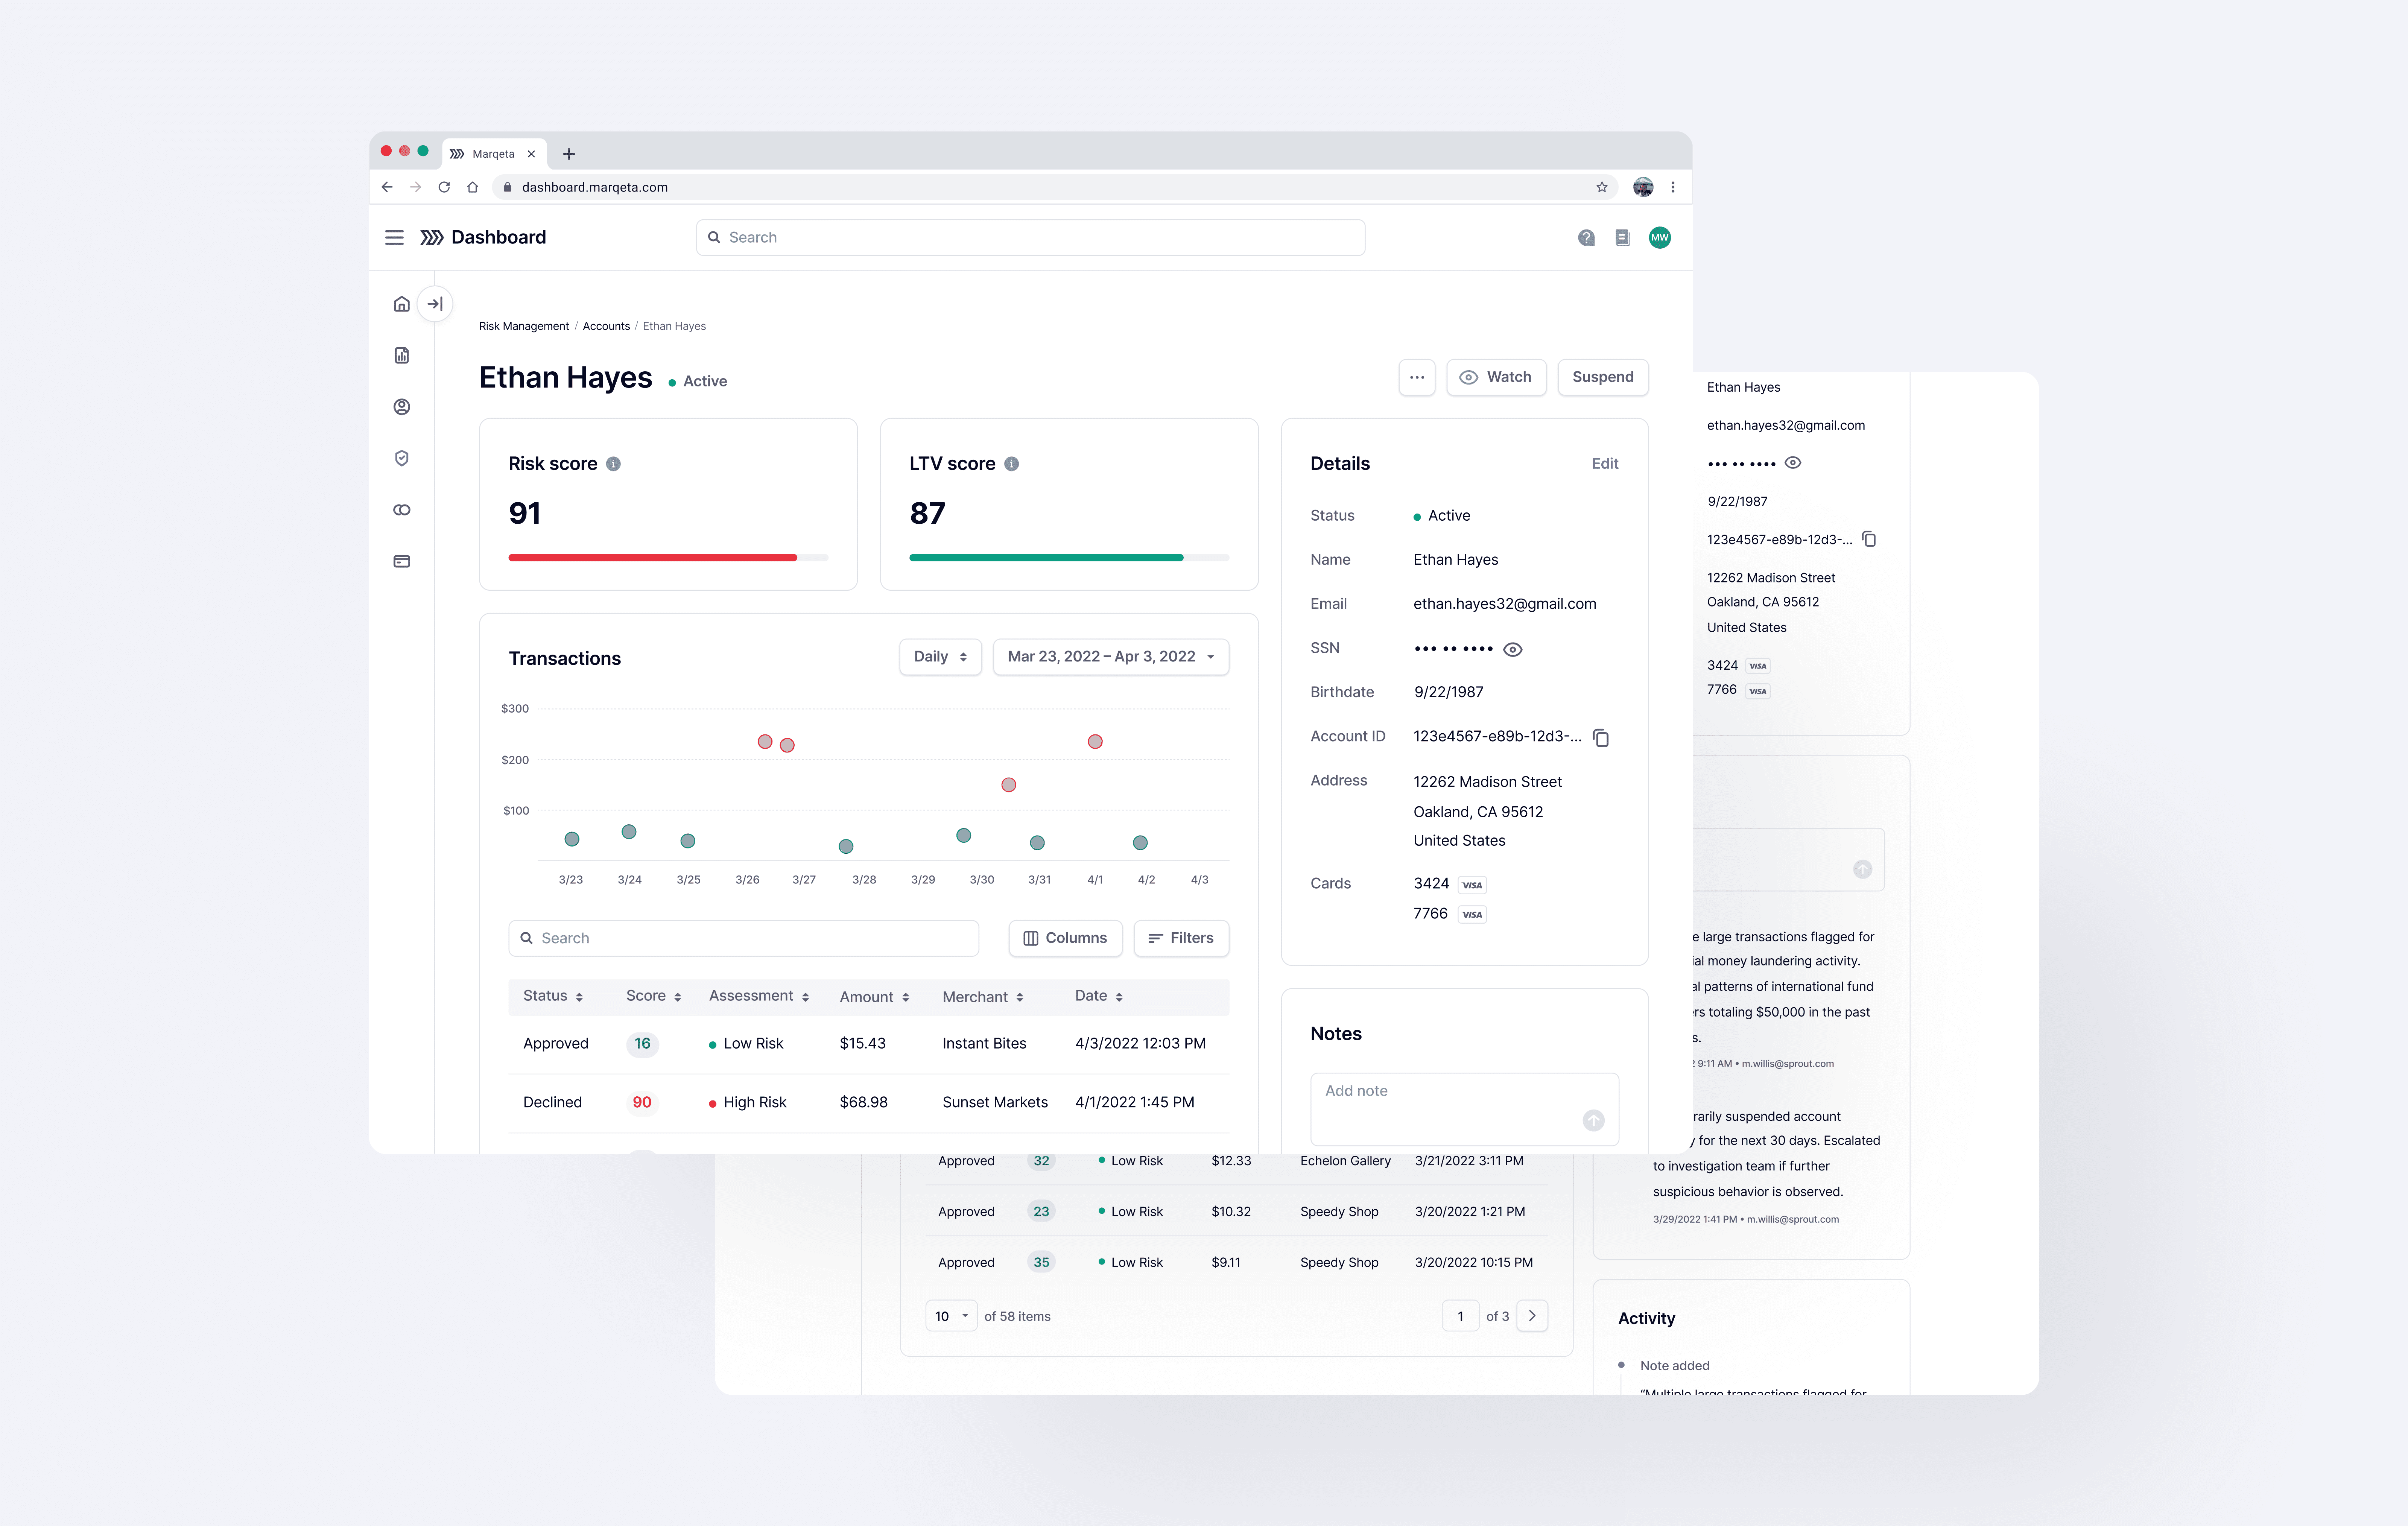
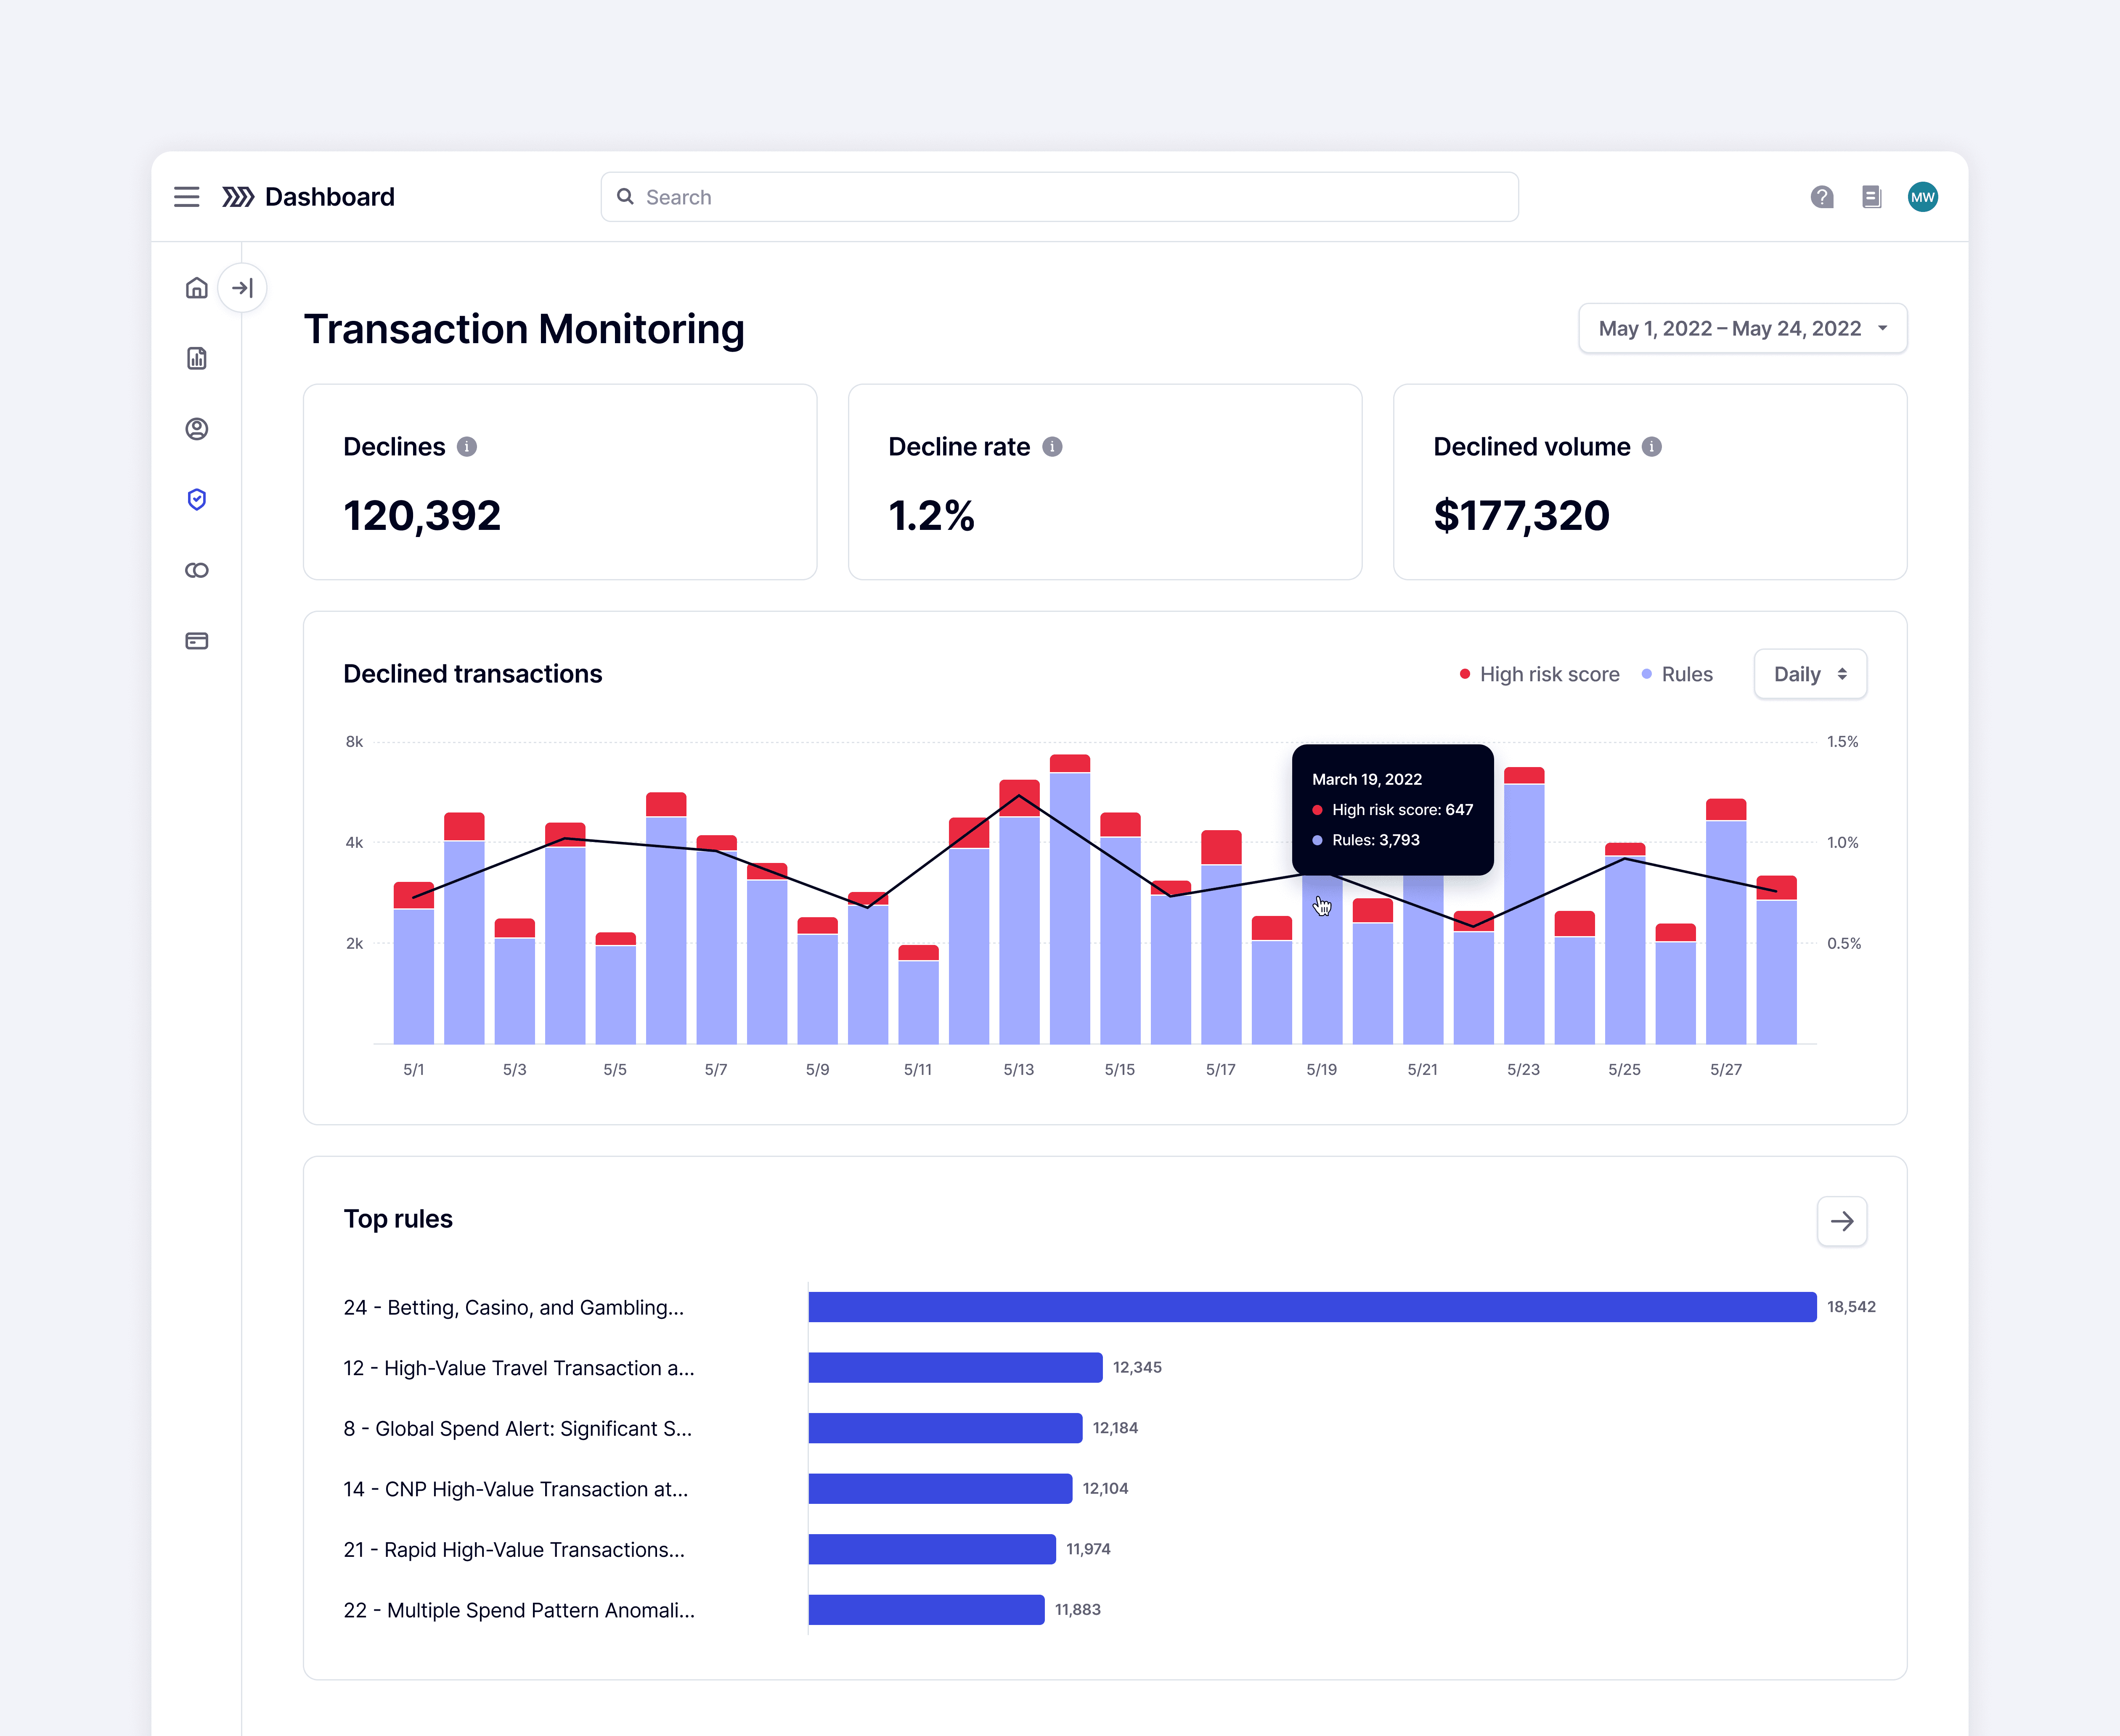
Understanding data at a glance
Since this was an MVP dashboard, our goal was to keep this initial release lean and lightweight. We looked to launch quickly and provide risk teams with early access for feedback, which would allow us to iterate and expand based on their input.
Using data visualizations allowed analysts to quickly spot patterns, avoiding the need to manually sift through raw data. The column chart displays a hybrid view, distinguishing between declines triggered by custom rules and those flagged by the machine learning risk scoring model.
We focused on keeping the visualizations simple and intuitive to enhance clarity and ease of understanding.

Takeaways
Simple solutions can be effective
During early explorations, we experimented with variations that included more data and metrics on the page. However, after multiple feedback sessions and iterations, the simplest design consistently received the most positive feedback. This experience reinforced the value of simplicity and reminded me why straightforward solutions should never be overlooked.